Fig. 5.
Download original image
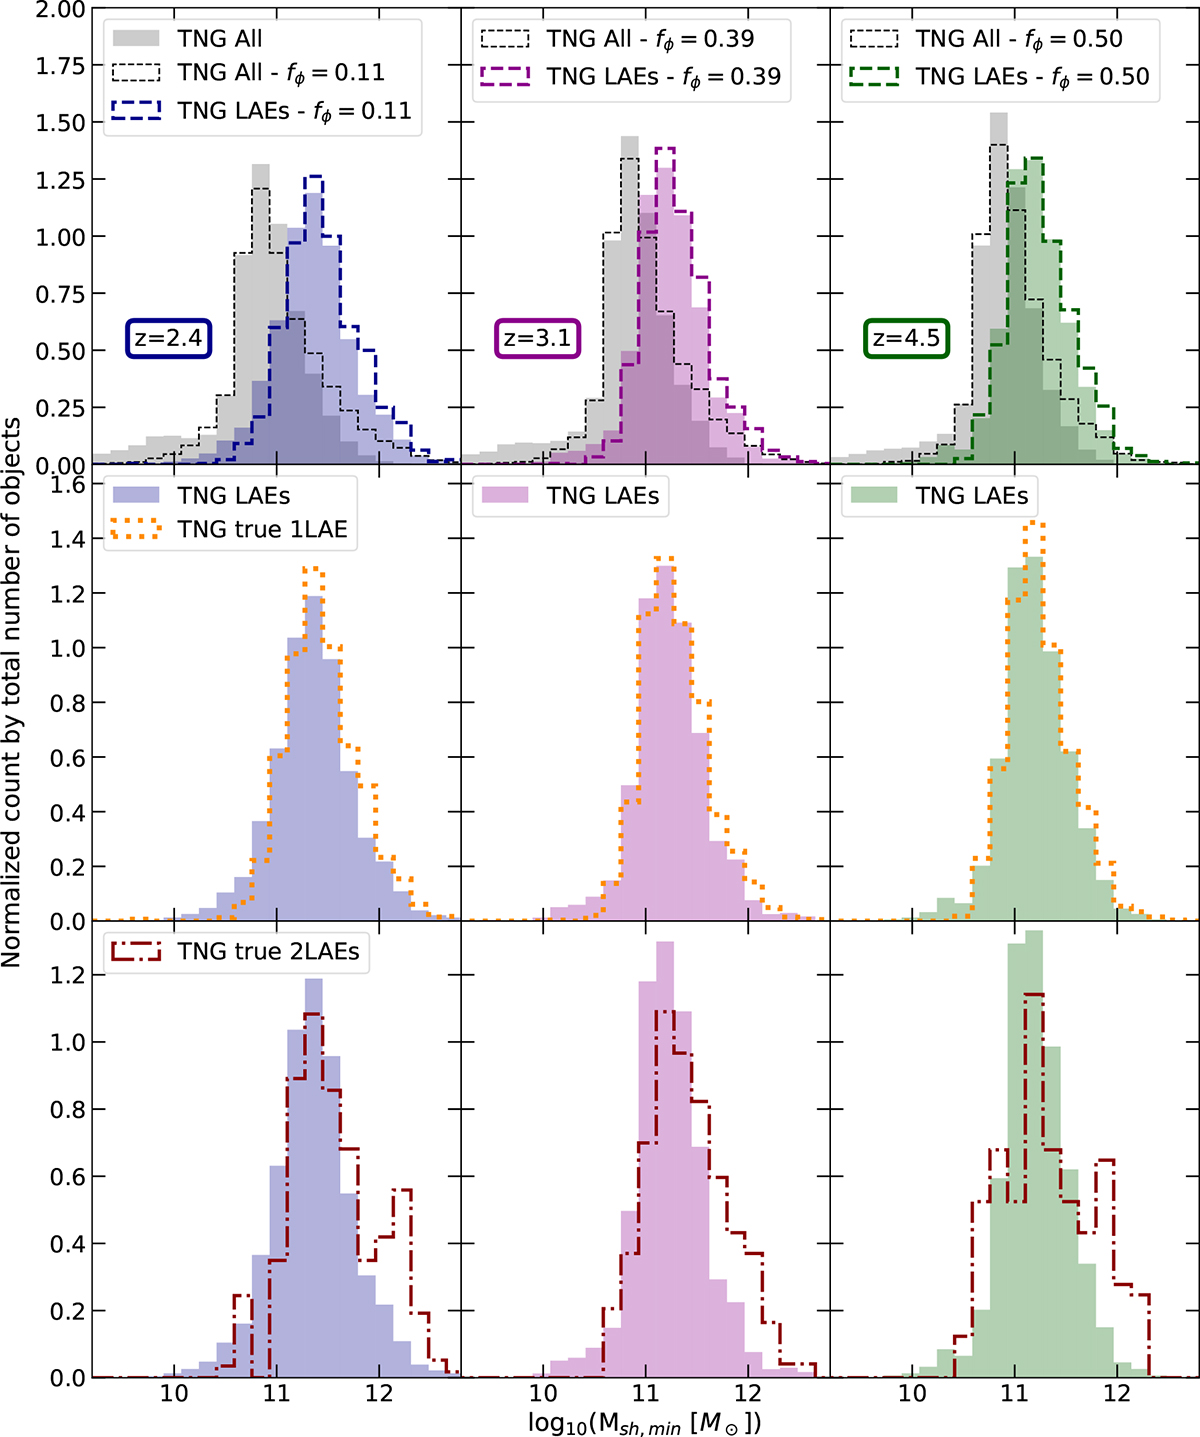
Distribution of minimum subhalo masses in the halos at z = 2.4 (left panel), z = 3.1 (middle panel), and 4.5 (right panel). In the top panels, the minimum subhalo mass distributions from TNG100 are shown as shaded black histograms, while the model predictions described in Section 5.3 are overplotted as dashed black lines (with fϕ = 0.11 and fM/fr = 2.43 at z = 2.4, fϕ = 0.39 and fM/fr = 0.78 at z = 3.1, and fϕ = 0.50 and fM/fr = 0.63 at z = 4.5). Using these factors, we test the model against all TNG100 LAEs (colored dashed lines in the top panels), TNG100 true 1 LAEs (dotted orange lines in the middle panels), and TNG100 true 2 LAEs (dash-dotted red lines in the bottom panels), comparing them with the corresponding minimum subhalo mass distributions of TNG100 LAES (shaded colored histograms). The model shows a good agreement with the minimum subhalo mass distribution for all galaxies, for all LAEs, and isolated LAEs, but struggles to reproduce as closely the distribution for LAE pairs.
Current usage metrics show cumulative count of Article Views (full-text article views including HTML views, PDF and ePub downloads, according to the available data) and Abstracts Views on Vision4Press platform.
Data correspond to usage on the plateform after 2015. The current usage metrics is available 48-96 hours after online publication and is updated daily on week days.
Initial download of the metrics may take a while.