Fig. 1
Download original image
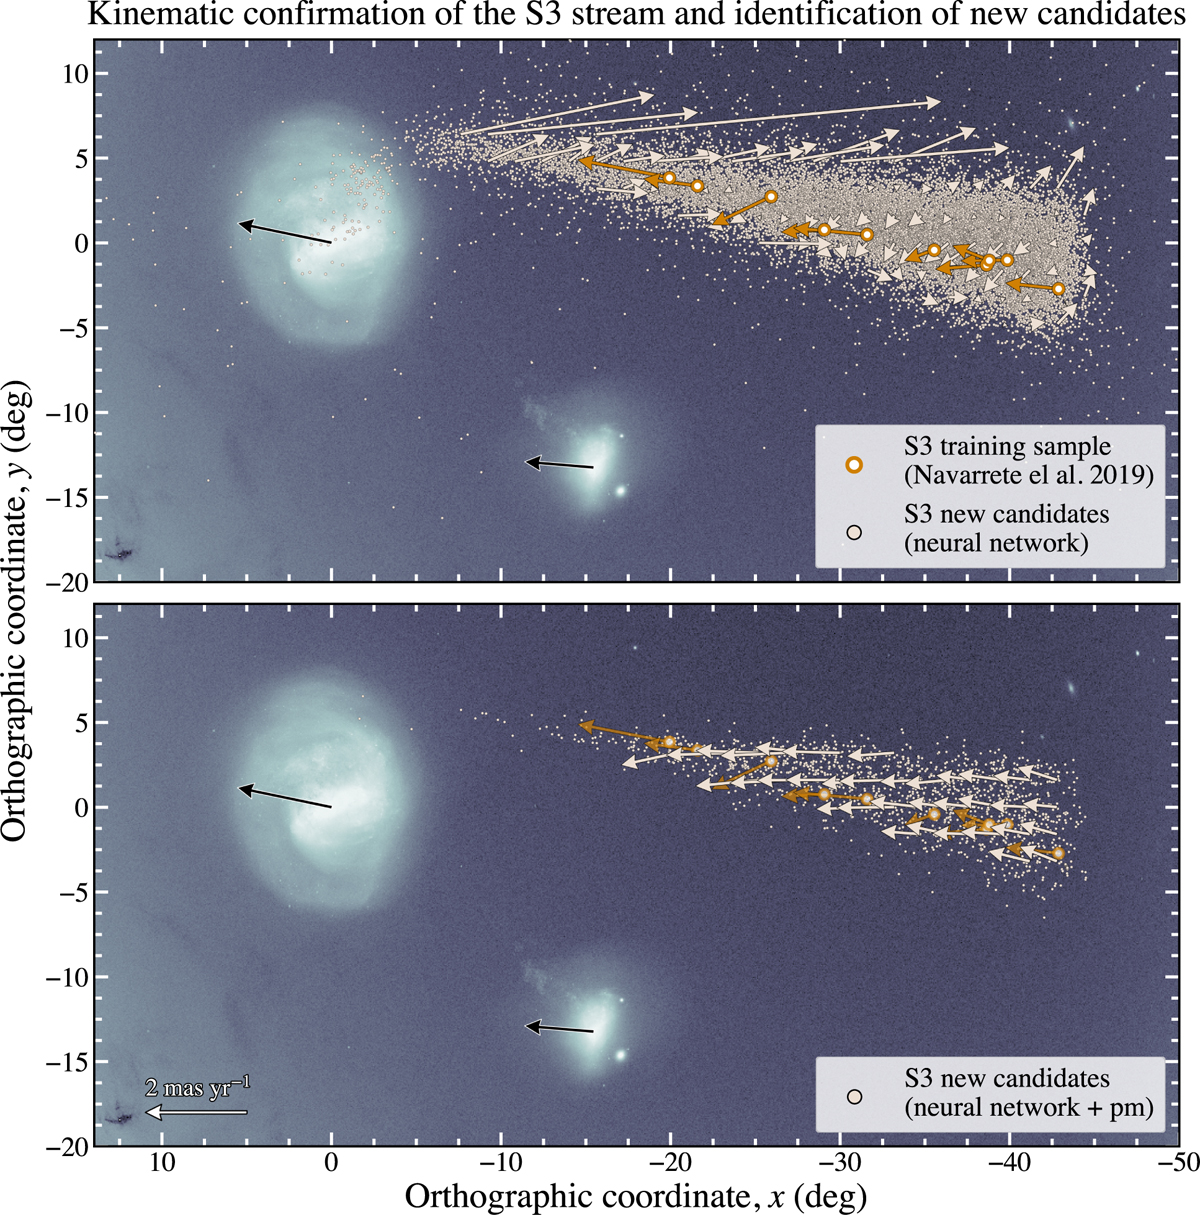
Comparison of the on-sky distribution of the N19’s BHB–BS S3 training sample (orange circles) to the newly identified S3 candidates (beige circles), shown in the top panel using the neural network classifier alone, and in the bottom panel using both the neural network classifier and a polygon selection in proper motion space (see Sect. 3.1). The arrows’ orientation and length indicate the direction and magnitude of the stars’ motion across the sky, with a 2 mas yr−1 white arrow shown as a reference in the bottom panel. For the newly identified S3 candidates, we computed the median direction and magnitude of their motion across the sky within 1.6 × 1.6 deg2 bins, displaying the results only for bins containing more than 20 stars. The black arrows indicate the systemic motion of the LMC and SMC. The background image corresponds to a 2D histogram of the Gaia DR3 sample utilised in this study (see Sect. 2.2), consisting of 28 million stars that include both stars from the Clouds and foreground halo stars of the MW. Both panels are displayed using the orthographic projection (x, y, vx, vy) of the standard celestial coordinates (α, δ) and proper motions (μα*, μδ), centred in the LMC photometric centre, defined as (αc, δc) = (81.28°, −69.78°) by van der Marel (2001).
Current usage metrics show cumulative count of Article Views (full-text article views including HTML views, PDF and ePub downloads, according to the available data) and Abstracts Views on Vision4Press platform.
Data correspond to usage on the plateform after 2015. The current usage metrics is available 48-96 hours after online publication and is updated daily on week days.
Initial download of the metrics may take a while.