Fig. 2
Download original image
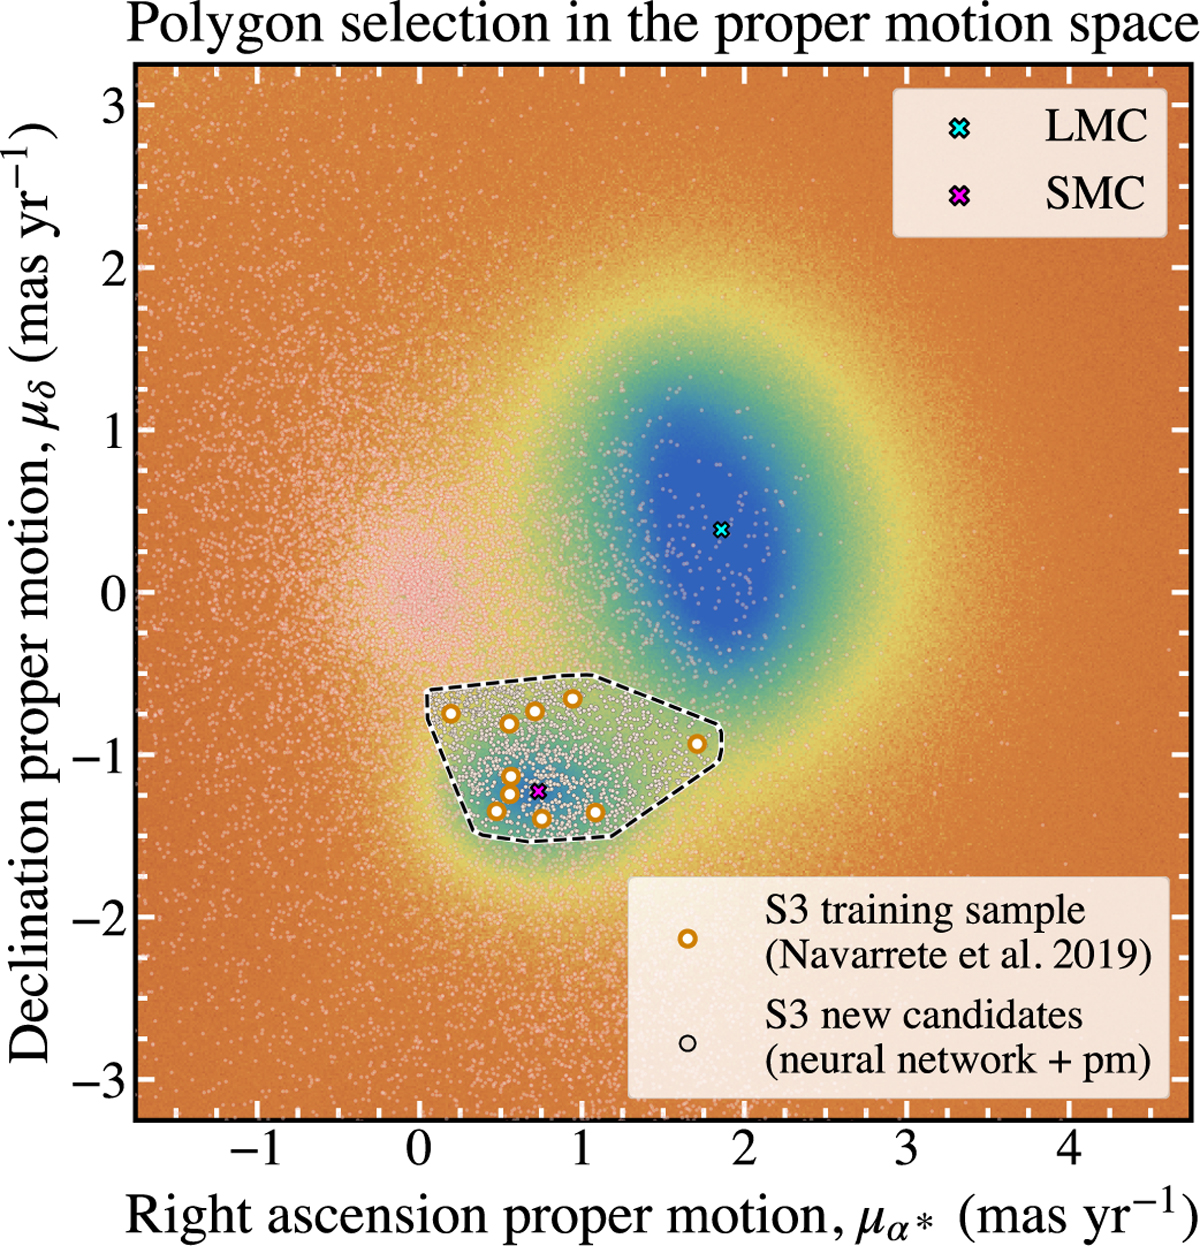
Comparison of the proper motion distribution between the BHB–BS S3 training sample from N19 (orange circles) and the newly identified S3 candidates (beige and red transparent circles), overlaid on the Gaia DR3 sample (background histogram; see Sect. 2.2). The dashed black and white line indicates the polygon selection applied in proper motion space (see Sect. 3.1). The newly identified S3 candidates are shown in beige if they lie inside the polygon selection, and in transparent red if they fall outside it. The cyan and magenta crosses indicate the systemic motions of the LMC and SMC, respectively. In the background, regions of higher (lower) density are shown in bluer (redder) colour.
Current usage metrics show cumulative count of Article Views (full-text article views including HTML views, PDF and ePub downloads, according to the available data) and Abstracts Views on Vision4Press platform.
Data correspond to usage on the plateform after 2015. The current usage metrics is available 48-96 hours after online publication and is updated daily on week days.
Initial download of the metrics may take a while.