Fig. B.2
Download original image
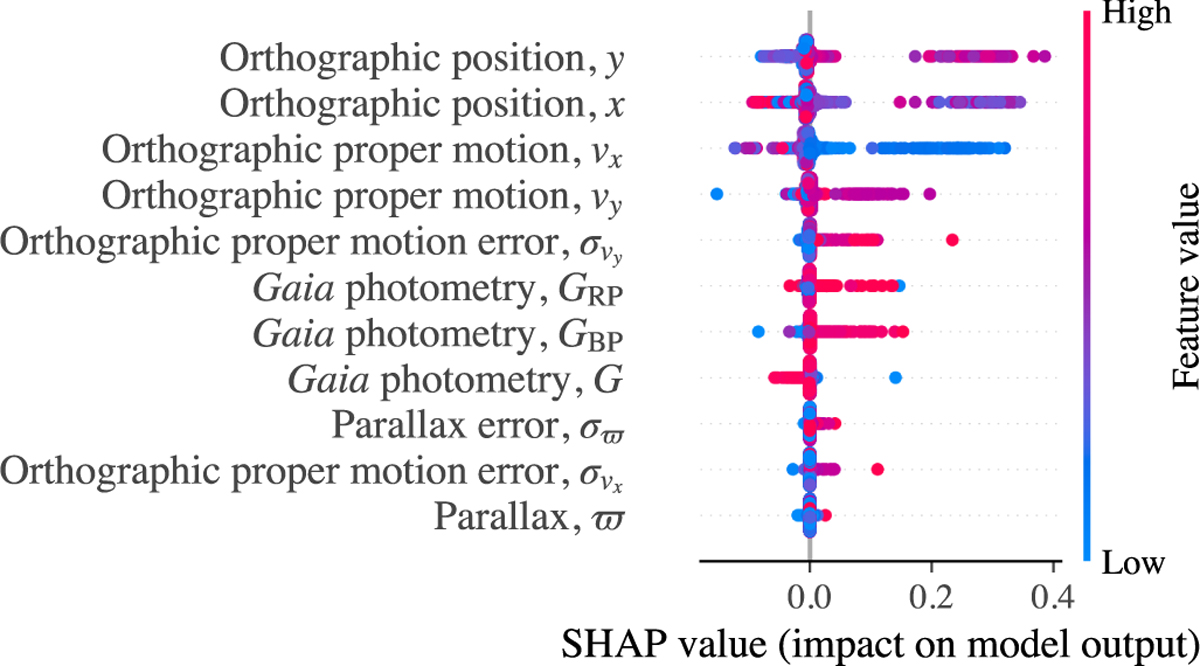
SHAP summary plot showing the impact of Gaia DR3 astrometric and photometric features on the S3 neural network model (see Sect. 3.1) output. Each dot represents an individual star from the test sample, which includes 4080 stars – accounting for 40% of the total dataset of 10 200 stars used for training and testing. Dot colour indicates the feature value (red for high, blue for low), while the position along the x-axis shows the SHAP value – that is, the feature’s contribution to the classification decision. Features are ordered from top to bottom by their overall importance, with those higher on the list having greater influence on the model’s output.
Current usage metrics show cumulative count of Article Views (full-text article views including HTML views, PDF and ePub downloads, according to the available data) and Abstracts Views on Vision4Press platform.
Data correspond to usage on the plateform after 2015. The current usage metrics is available 48-96 hours after online publication and is updated daily on week days.
Initial download of the metrics may take a while.