Fig. 1.
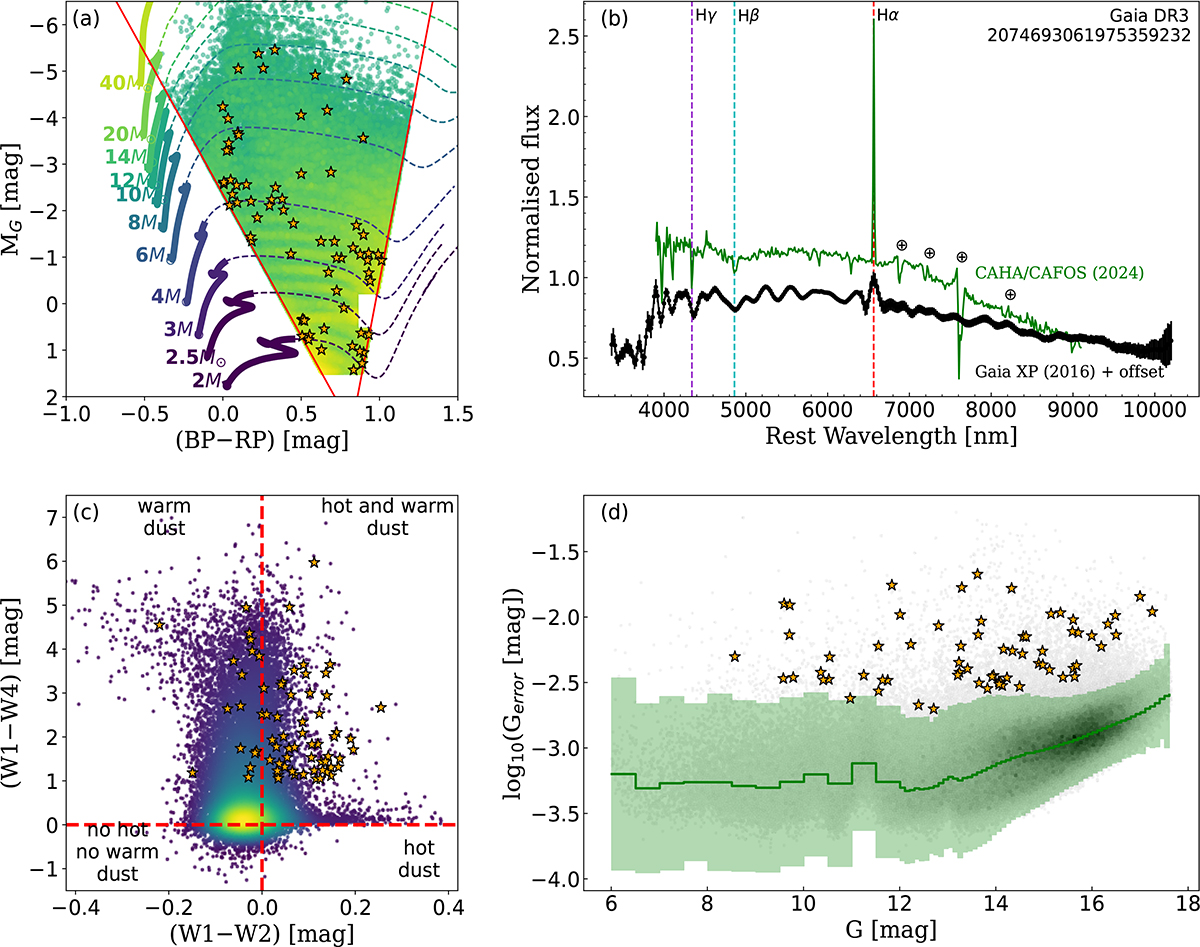
Download original image
Initial selection of our sample of mass-transferring candidates, based on a) the Gaia EDR3 StarHorse colour-magnitude diagram, b) the Gaia XP spectra, c) the AllWISE colour-colour diagram, and d) the GaiaG-band variability. In a, c, and d, we show the final sample of 67 candidates as orange stars. The red lines in a show the cuts used to select stars between the MS and the RGB based on MESA Isochrones & Stellar Tracks. In b, we show the Gaia XP spectrum of one of the sources in our sample as an example, and we compare it with our follow-up spectrum taken with CAFOS (see Section 3.2), and the ⊕ symbols represent telluric absorption (absorption by the Earth’s atmosphere). The red dashed lines in panel c indicate the zero levels and divide the plot into four regions: warm dust, hot dust, both hot and warm dust, and no hot or warm dust. The shaded green region in d corresponds to the 90th percentile of the initial HG sample.
Current usage metrics show cumulative count of Article Views (full-text article views including HTML views, PDF and ePub downloads, according to the available data) and Abstracts Views on Vision4Press platform.
Data correspond to usage on the plateform after 2015. The current usage metrics is available 48-96 hours after online publication and is updated daily on week days.
Initial download of the metrics may take a while.