Fig. 10.
Download original image
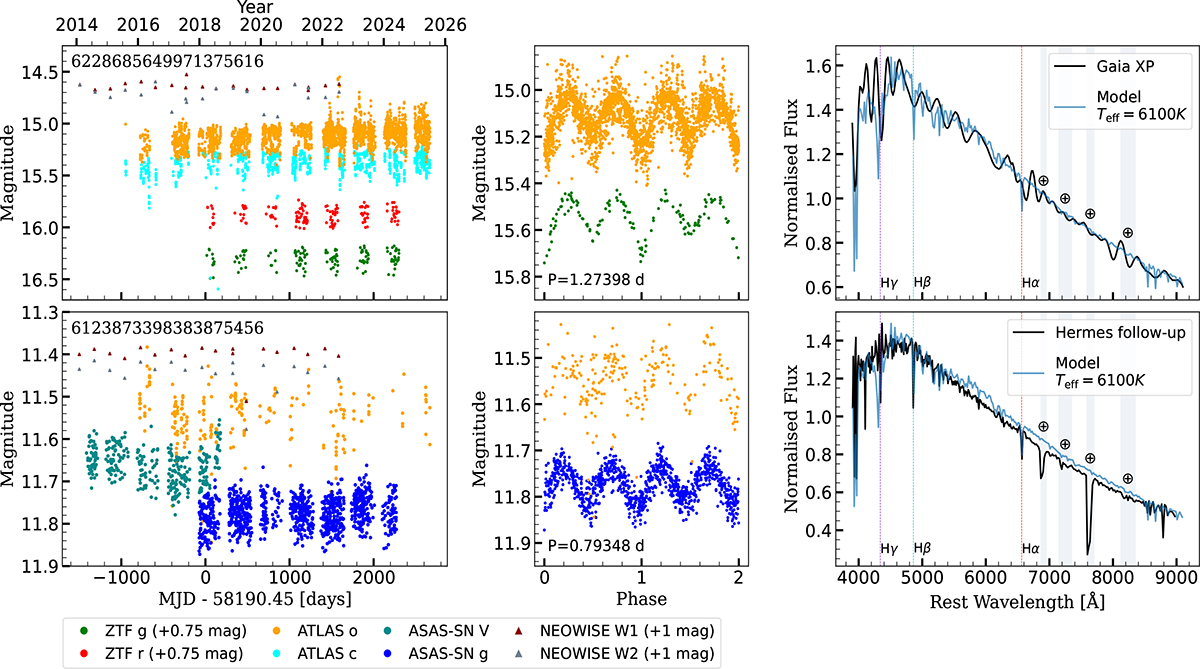
Light curve (left column), phase-folded light curve (middle column), and spectrum (right column) of our two best candidates for mass-transferring merger progenitors: 6228685649971375616 (top row) and 6123873398383875456 (bottom row). For both sources, a model spectrum from the Castelli–Kurucz Atlas (Castelli et al. 2003), with Teff = 6100 K and log g = 3.75, is shown for comparison. The ZTF and NEOWISE data in the light curves (left column) are offset for visual clarity, and the reference modified Julian date (MJD) in the light curve corresponds to the start of observations by ZTF. Although we report a sinusoidal period of 0.39674 d for 6123873398383875456, the phase-folded light curve is shown using twice this period, consistent with our interpretation of the source as a contact eclipsing binary. The ⊕ symbols and shaded areas in the spectra (right column) represent telluric absorption (absorption by the Earth’s atmosphere).
Current usage metrics show cumulative count of Article Views (full-text article views including HTML views, PDF and ePub downloads, according to the available data) and Abstracts Views on Vision4Press platform.
Data correspond to usage on the plateform after 2015. The current usage metrics is available 48-96 hours after online publication and is updated daily on week days.
Initial download of the metrics may take a while.