Open Access
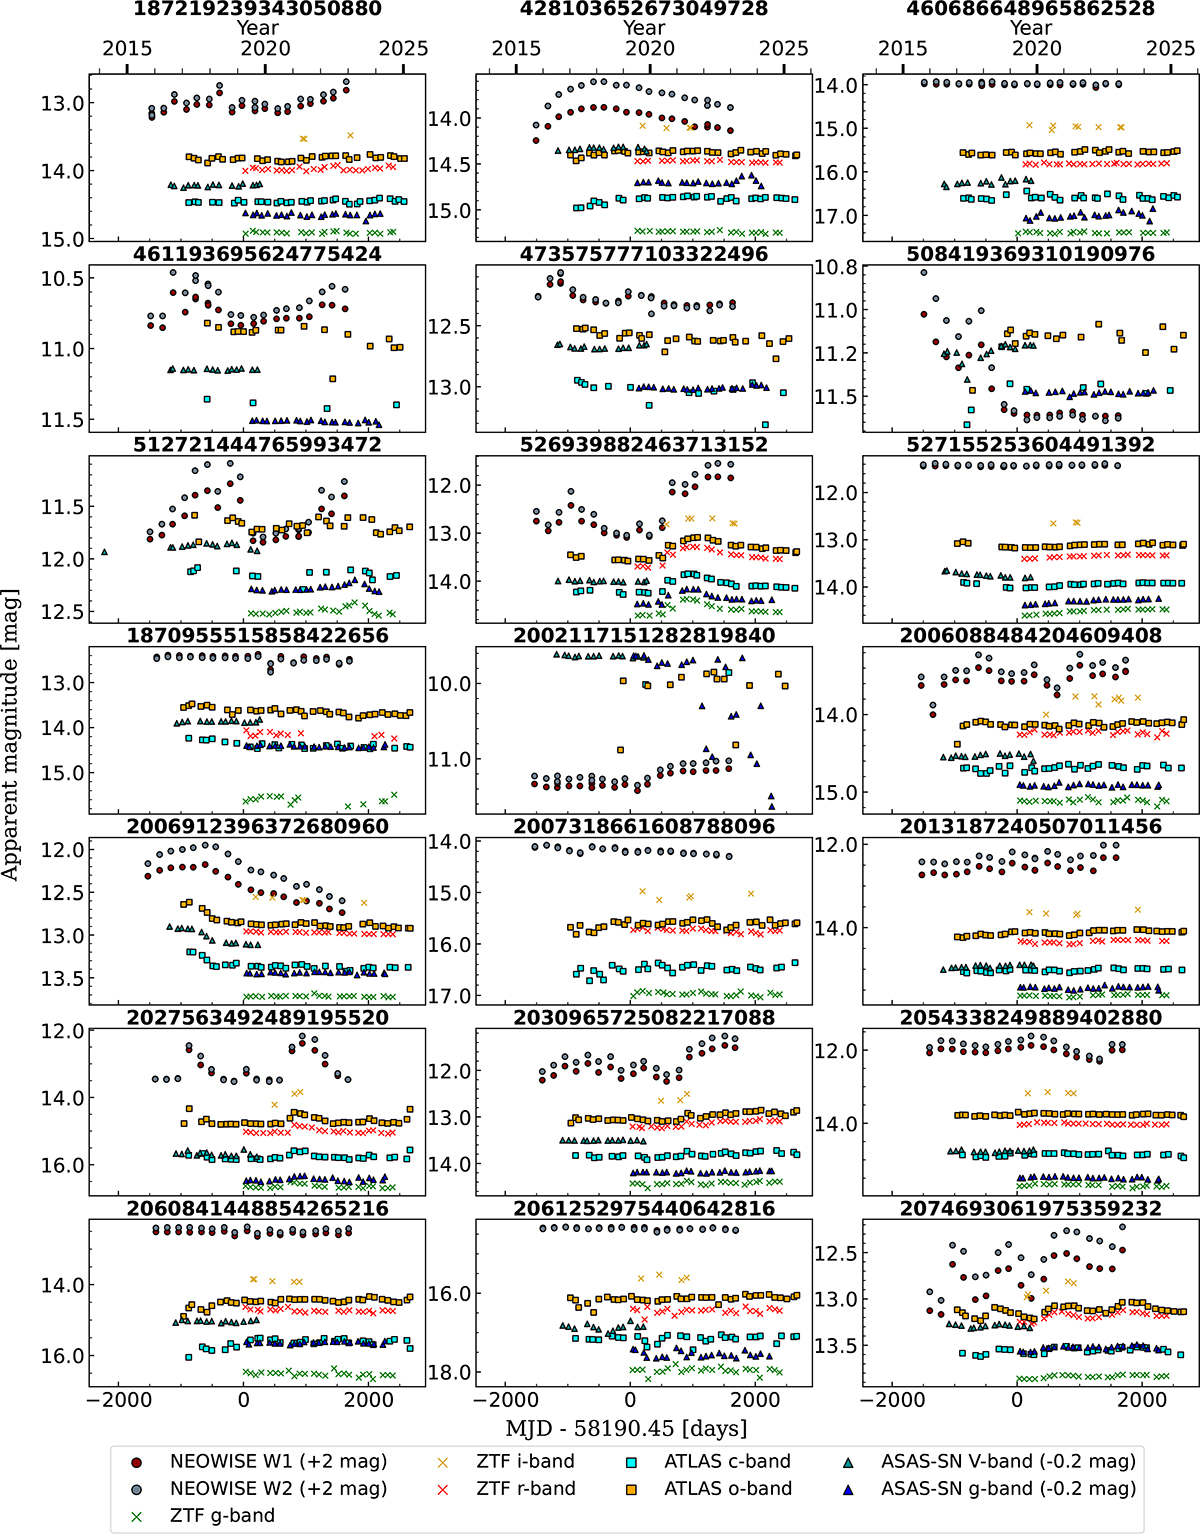
Fig. C.1.
Download original image
Optical and infrared light curves for the sources in our sample, binned in 50-day intervals. The reference modified Julian date (MJD) corresponds to the start of observations by ZTF. The number shown above each panel corresponds to the Gaia DR3 source ID.
Current usage metrics show cumulative count of Article Views (full-text article views including HTML views, PDF and ePub downloads, according to the available data) and Abstracts Views on Vision4Press platform.
Data correspond to usage on the plateform after 2015. The current usage metrics is available 48-96 hours after online publication and is updated daily on week days.
Initial download of the metrics may take a while.