Fig. C.4.
Download original image
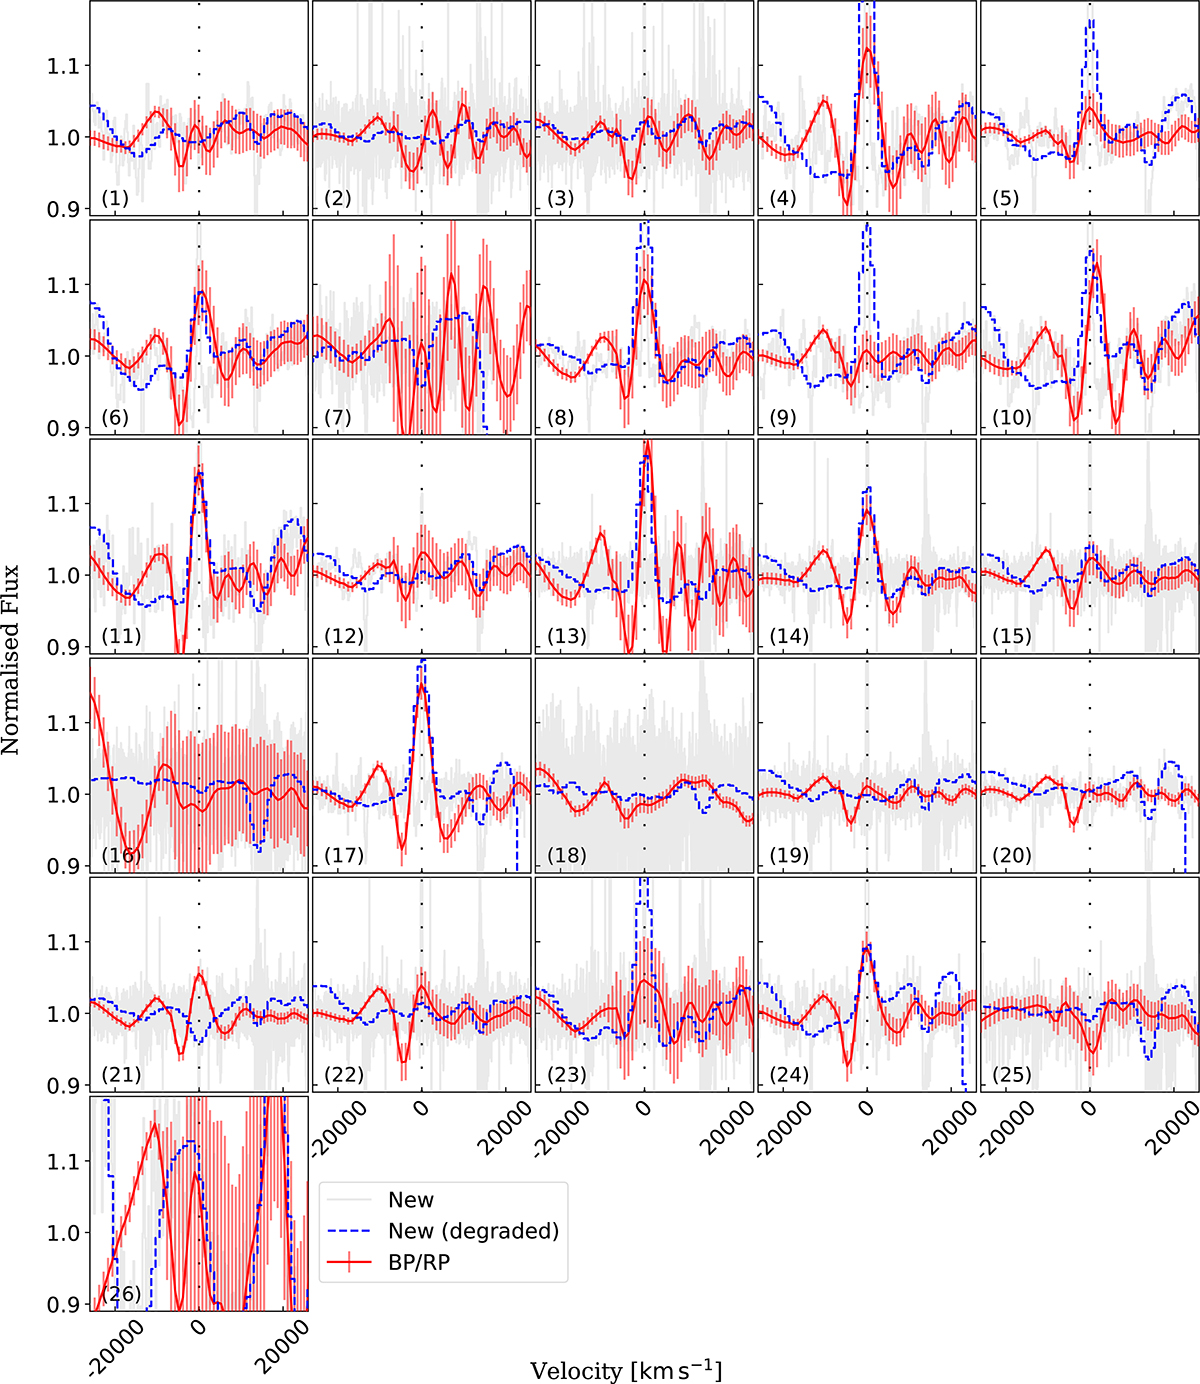
Flux normalised Hα velocity profiles for the subsample of observed sources (similar to Fig. 5). We compare the Gaia low-resolution BP/RP spectrum (red solid line) with our new follow-up spectrum, degraded to match the BP/RP resolution (blue dashed line). The original-resolution follow-up spectrum is plotted in grey for comparison. All sources are shown on the same scale. The index corresponding to each source (see Table B.2) is shown in the bottom left corner of each spectrum.
Current usage metrics show cumulative count of Article Views (full-text article views including HTML views, PDF and ePub downloads, according to the available data) and Abstracts Views on Vision4Press platform.
Data correspond to usage on the plateform after 2015. The current usage metrics is available 48-96 hours after online publication and is updated daily on week days.
Initial download of the metrics may take a while.