Open Access
Fig. 3.
Download original image
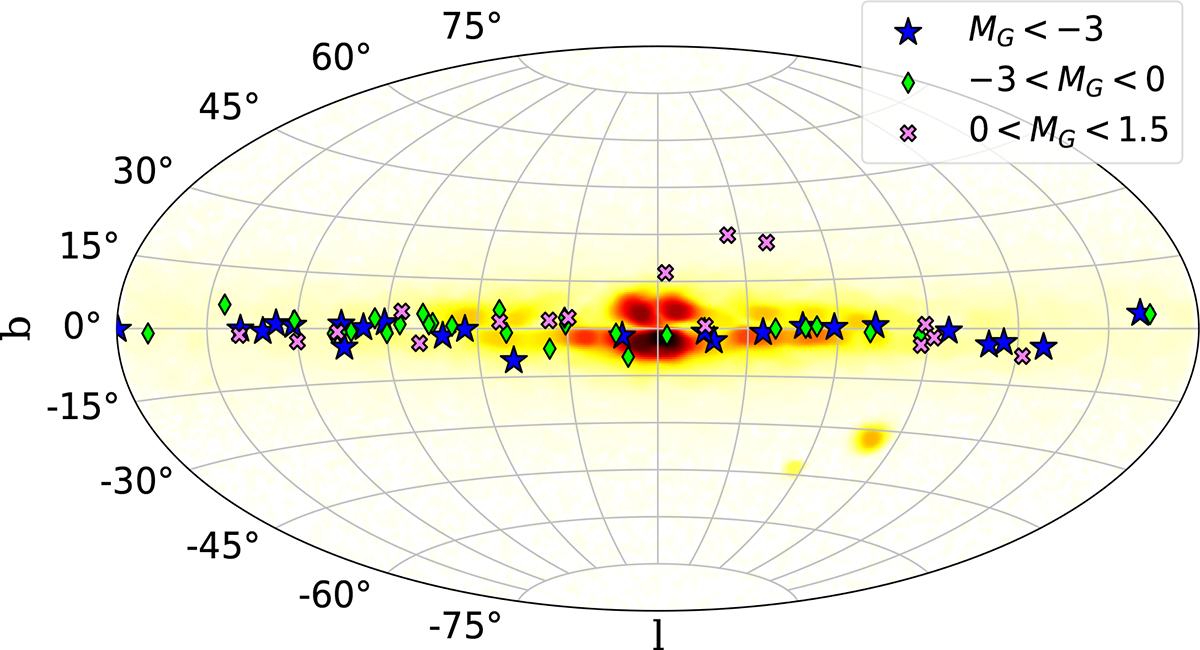
Sky map showing the position of the 67 sources in our initial sample with reference to the Galactic density of stars, constructed with a Gaia DR3 random data set containing 100 000 sources. Different ranges of absolute magnitude are shown with different markers.
Current usage metrics show cumulative count of Article Views (full-text article views including HTML views, PDF and ePub downloads, according to the available data) and Abstracts Views on Vision4Press platform.
Data correspond to usage on the plateform after 2015. The current usage metrics is available 48-96 hours after online publication and is updated daily on week days.
Initial download of the metrics may take a while.