Fig. 4.
Download original image
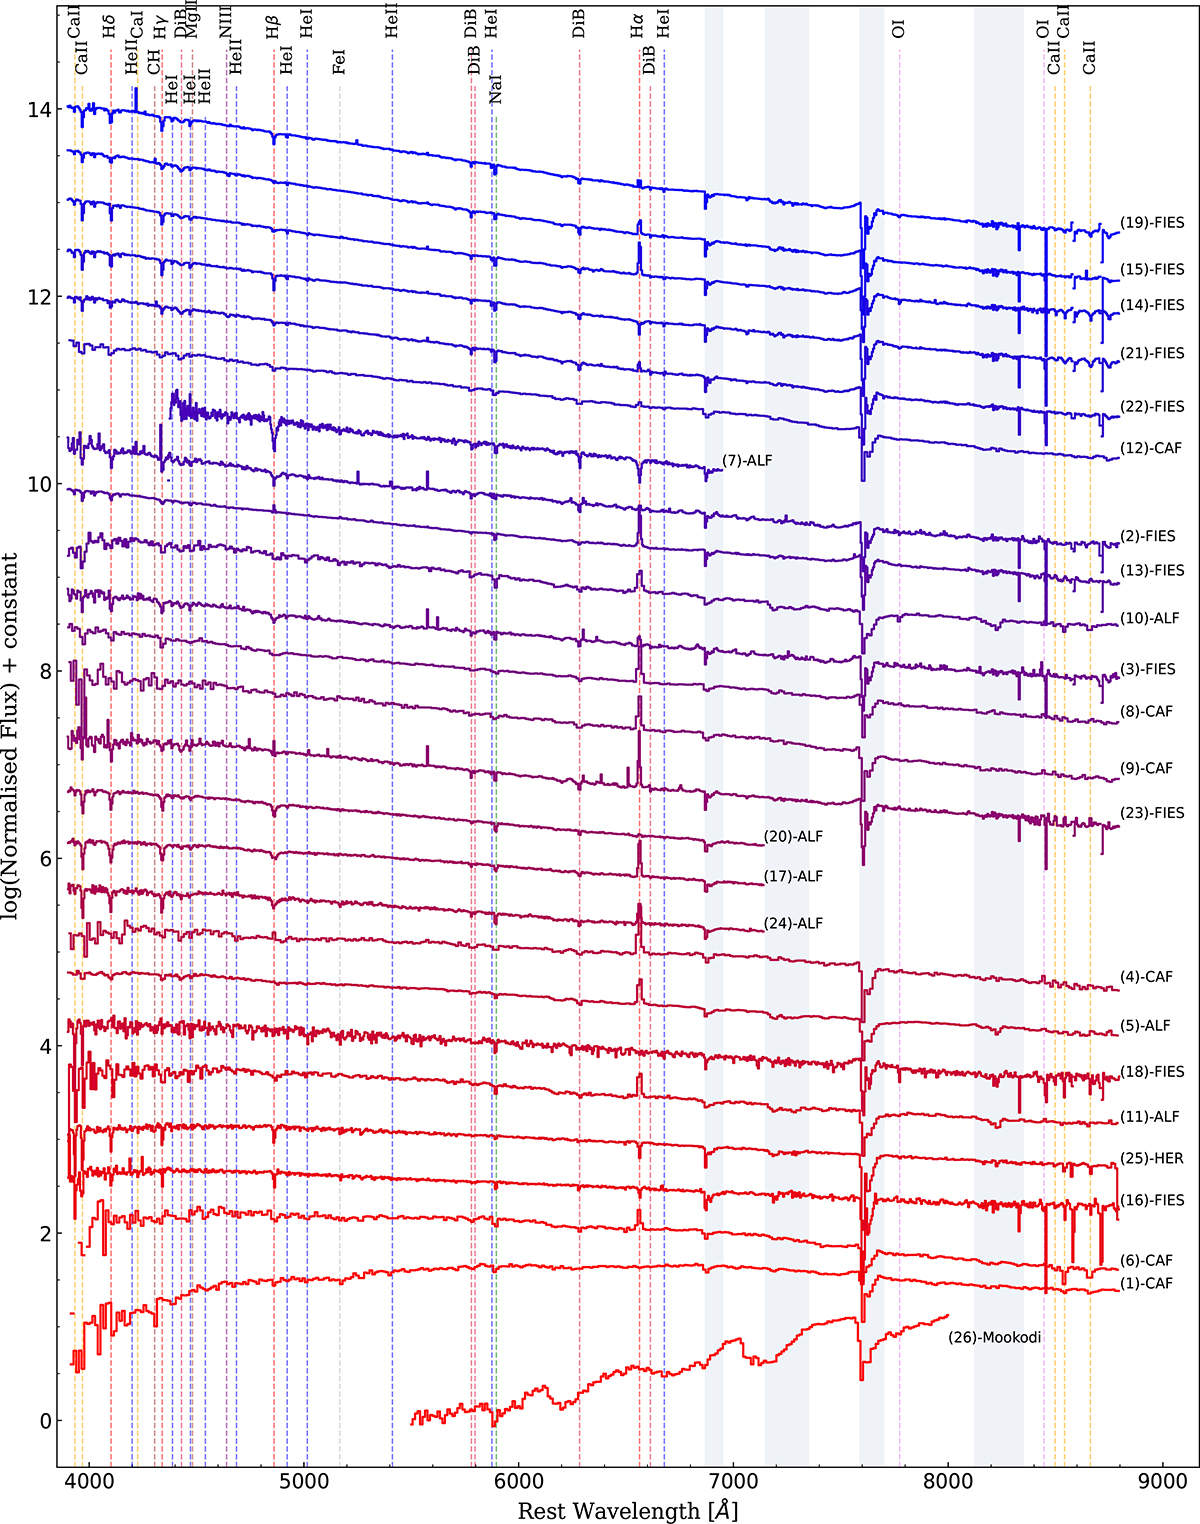
Optical spectra for the subsample of spectroscopically characterised sources. Each spectrum, except for the Mookodi spectrum, is de-reddened for visualisation purposes using the best extinction values (see Sect. 6.1, Table B.1), with Fitzpatrick (1999) dust extinction function and RV = 3.1. The main emission and absorption lines are indicated. The areas with strong telluric absorption are shown by the shaded rectangles. On the right, the number in parentheses indicates the index associated with each source (see Table B.2), and this index is followed by the instrument used to take each spectrum: CAFOS (CAF) from the Calar Alto Observatory 2.2 m telescope, HERMES from the Mercator telescope, FIES and ALFOSC (ALF) from the Nordic Optical Telescope, and Mookodi from the South African Astronomical Observatory 1 m Lesedi telescope.
Current usage metrics show cumulative count of Article Views (full-text article views including HTML views, PDF and ePub downloads, according to the available data) and Abstracts Views on Vision4Press platform.
Data correspond to usage on the plateform after 2015. The current usage metrics is available 48-96 hours after online publication and is updated daily on week days.
Initial download of the metrics may take a while.