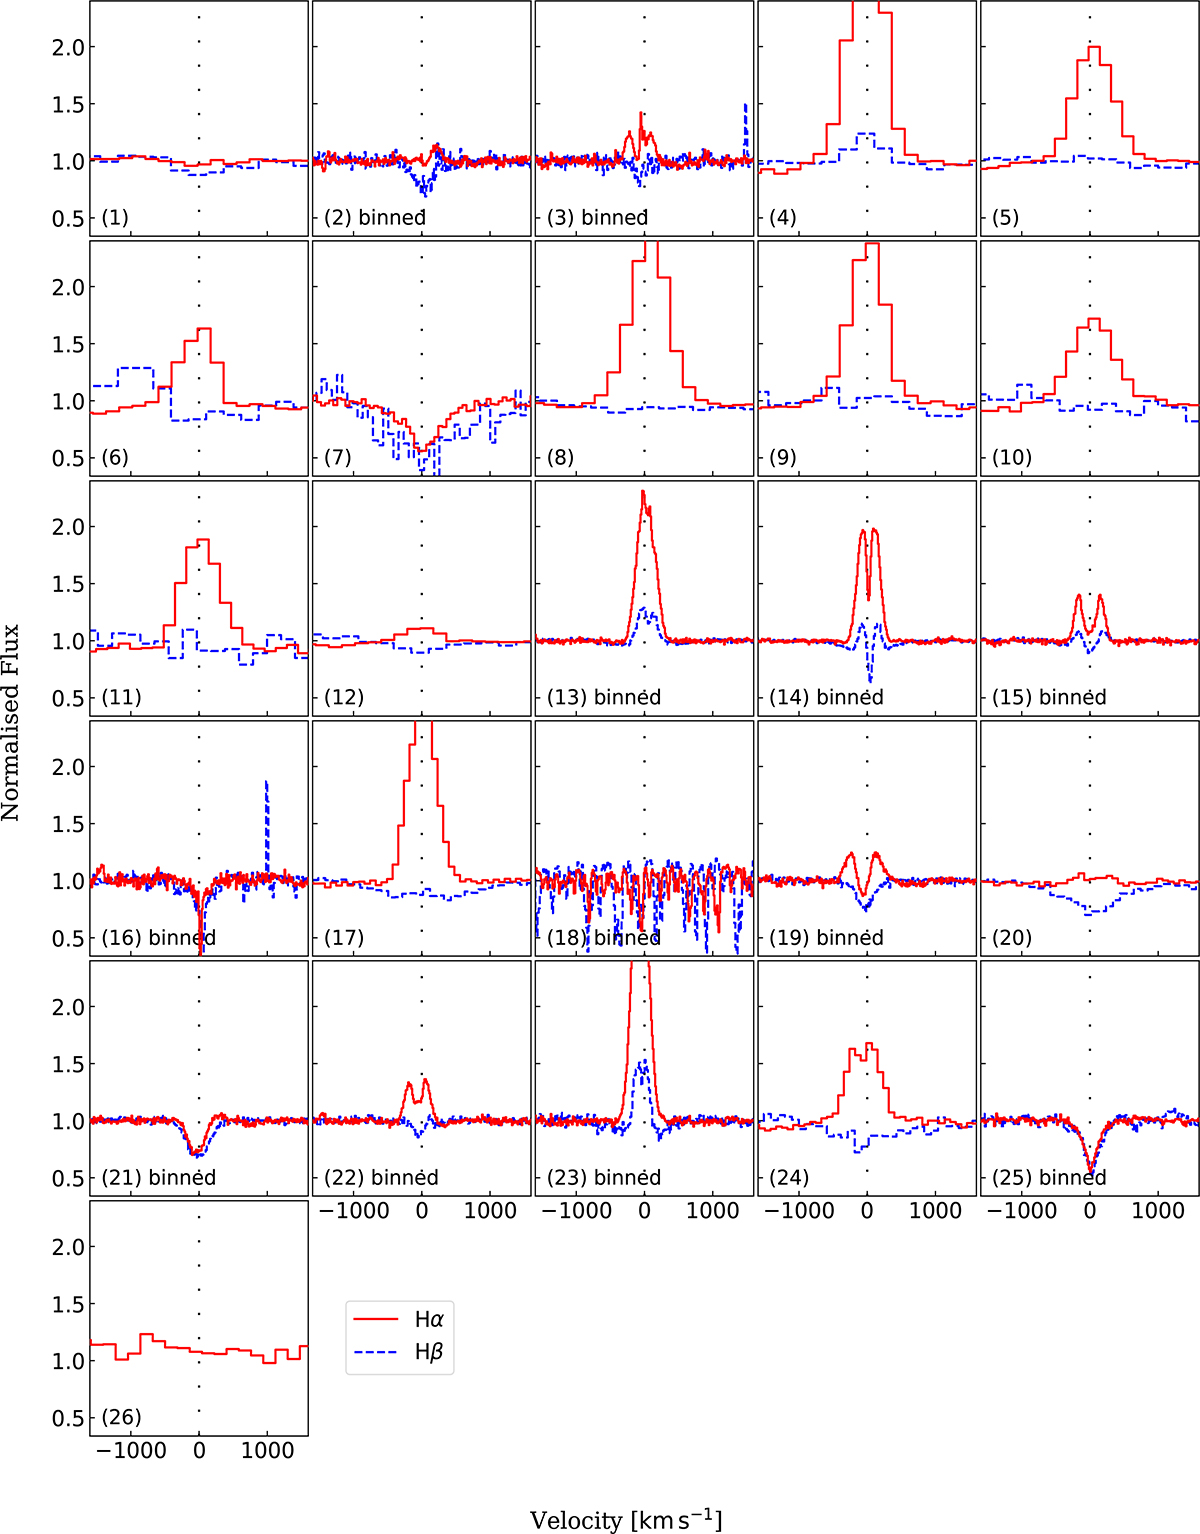
Fig. 5.
Download original image
Flux normalised Hα and Hβ velocity profiles for the subsample of observed sources. All sources are shown on the same scale. The index corresponding to each source (see Table B.2) is shown in the bottom left corner of each spectrum. Medium- and high-resolution spectra have been binned using 10 km s−1 bins for improved visual representation.
Current usage metrics show cumulative count of Article Views (full-text article views including HTML views, PDF and ePub downloads, according to the available data) and Abstracts Views on Vision4Press platform.
Data correspond to usage on the plateform after 2015. The current usage metrics is available 48-96 hours after online publication and is updated daily on week days.
Initial download of the metrics may take a while.