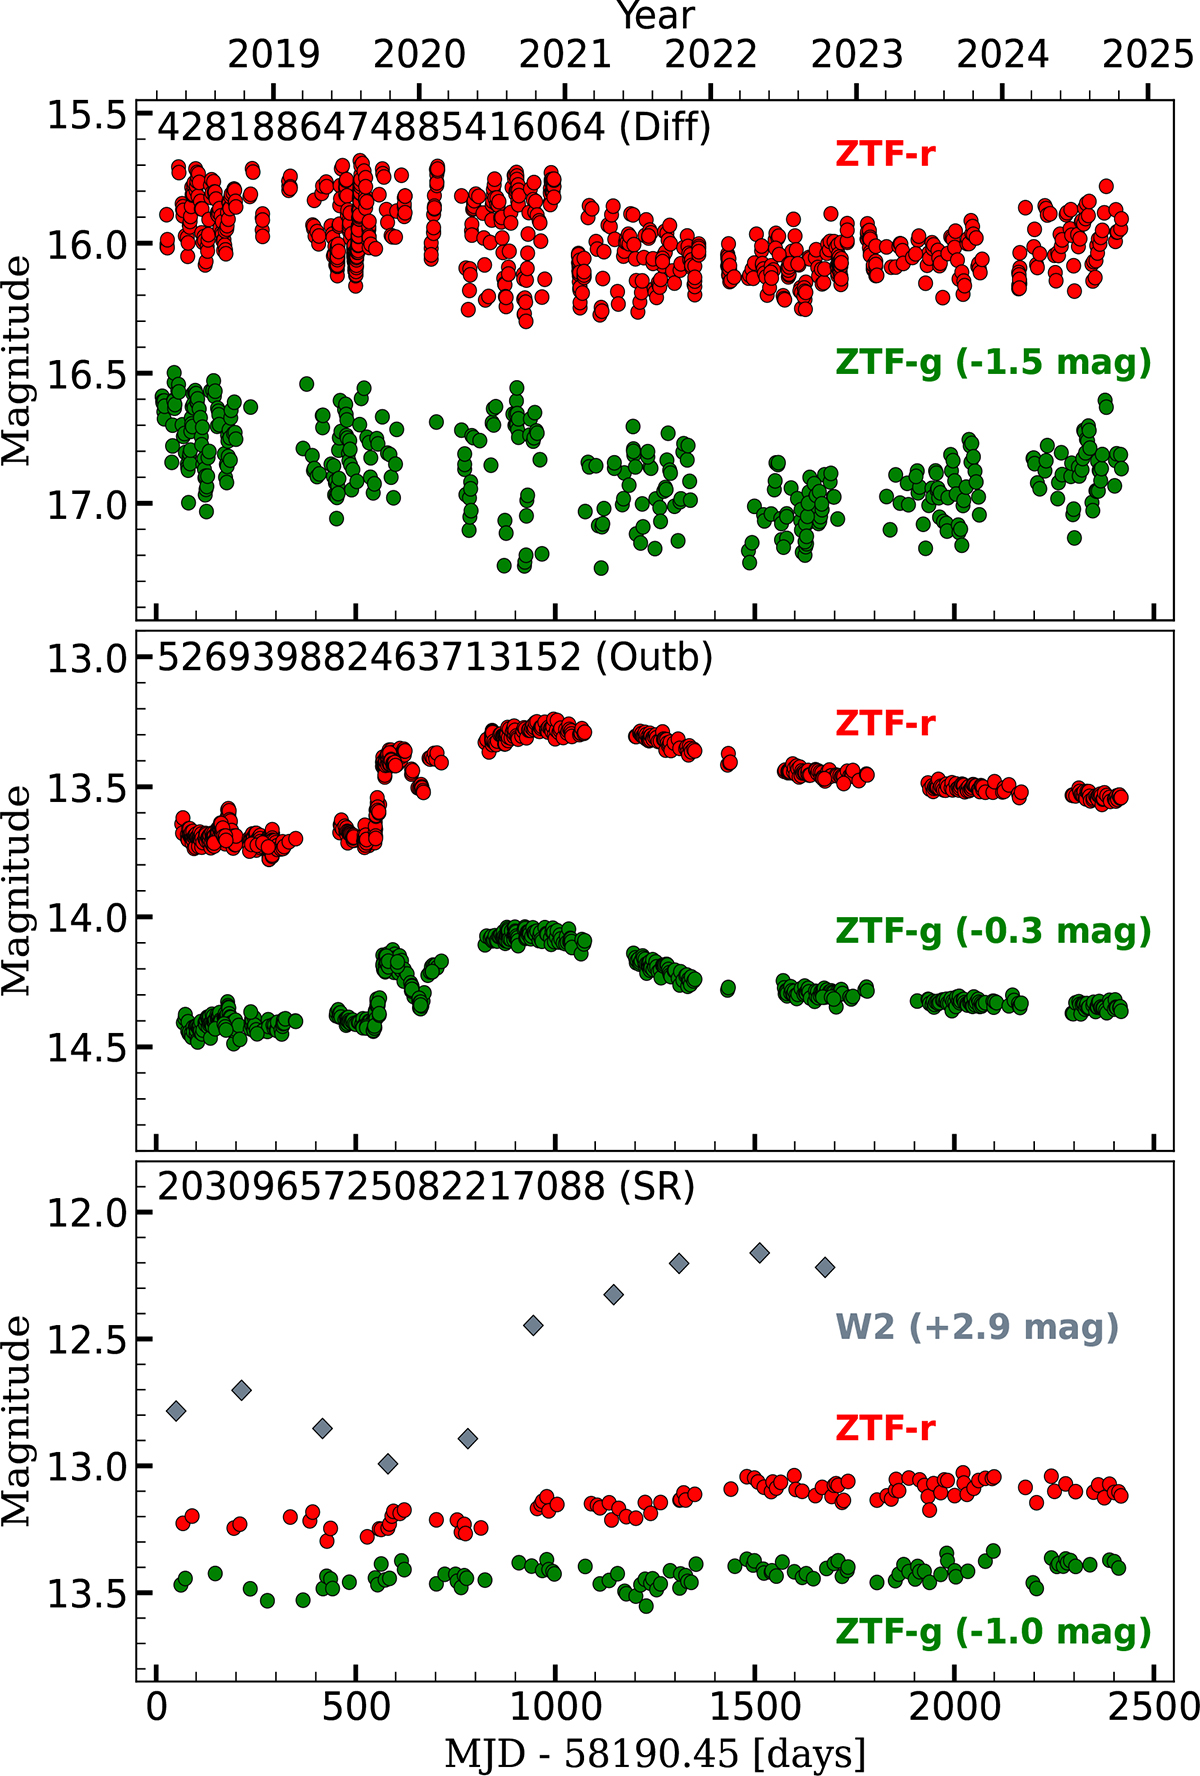
Fig. 6.
Download original image
Light curves of three sources in our sample illustrating the types of variability defined in this work (see Sect. 4.1.1). Circles represent the ZTF g band (green) and r band (red), while grey diamonds correspond to the NEOWISE W2 band. For clarity, the g-band and the W2-band light curves are vertically offset in all three panels, and the SR example is binned to better show its long-term evolution. The reference modified Julian date (MJD) corresponds to the start of the ZTF survey.
Current usage metrics show cumulative count of Article Views (full-text article views including HTML views, PDF and ePub downloads, according to the available data) and Abstracts Views on Vision4Press platform.
Data correspond to usage on the plateform after 2015. The current usage metrics is available 48-96 hours after online publication and is updated daily on week days.
Initial download of the metrics may take a while.