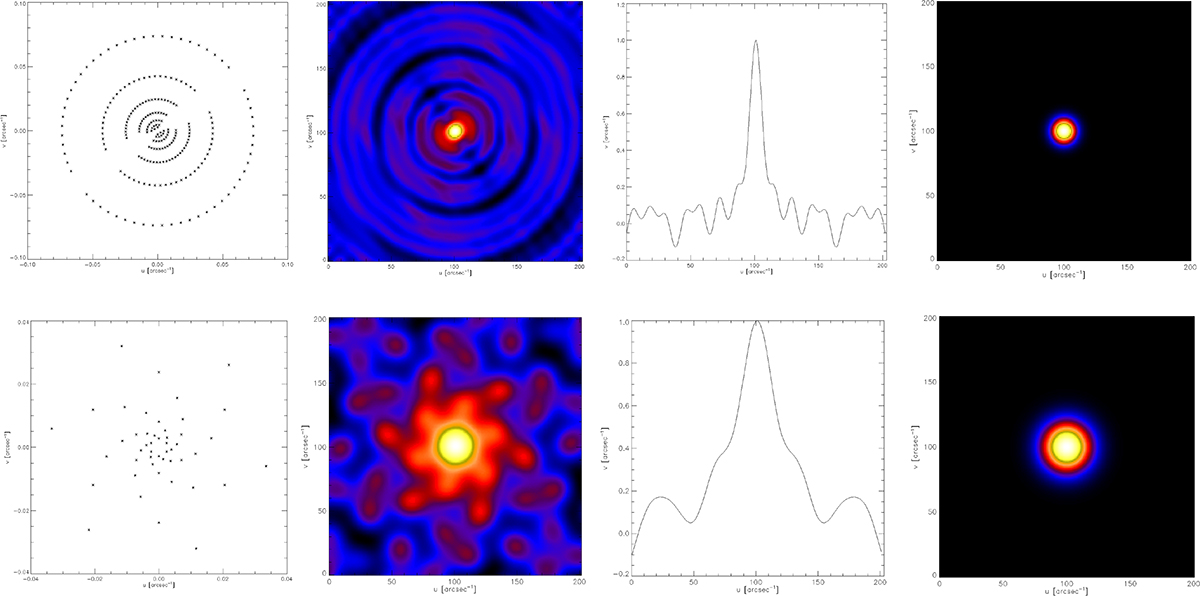
Fig. 1.
Download original image
Comparison between the imaging characteristics of RHESSI (top row) and STIX (bottom row). First column: Sampling of the (u, v) plane. Second column: PSFs. Third column: Central cut of the PSFs. Fourth column: Idealized PSFs obtained by fitting the central peak of the original PSFs. The top left panel describes a typical experimental (u, v) sampling from which some of the sampling points are missing because the corresponding visibilities did not pass the statistical quality check test.
Current usage metrics show cumulative count of Article Views (full-text article views including HTML views, PDF and ePub downloads, according to the available data) and Abstracts Views on Vision4Press platform.
Data correspond to usage on the plateform after 2015. The current usage metrics is available 48-96 hours after online publication and is updated daily on week days.
Initial download of the metrics may take a while.