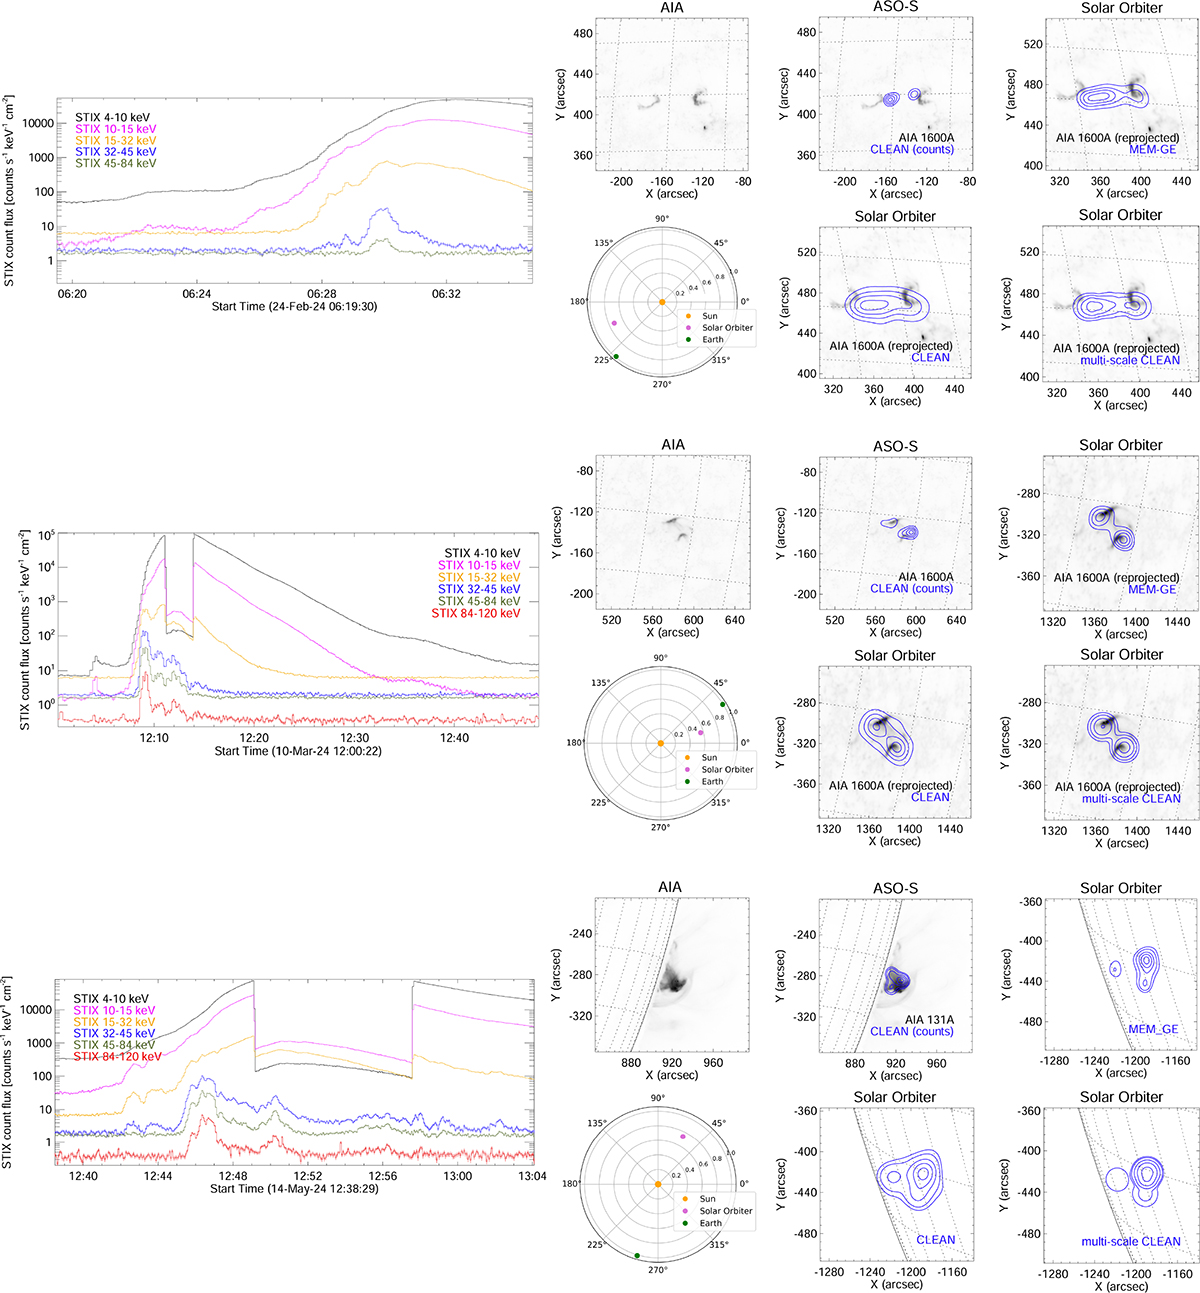
Fig. 5.
Download original image
Multiscale CLEAN for three real events observed by STIX: the February 24 2024 event in the time range 06:27:00–06:29:00 UT and for the 25–50 keV energy channel (first row); the March 10 2024 event in the time range 12:05:00–12:07:00 UT and for the 22–50 keV energy channel (second row); and the May 14 2024 event in the time range 12:46:55–12:47:55 UT for the 32–76 keV (third row). The first column contains the light curves. The second column provides the AIA map at 1600 Å for February 24 and March 10, at 131 Å for May 14 (top left panel); the HXI level curves reconstructed by CLEAN (top middle panel); the STIX level curves reconstructed by MEM_GE (top right panel); the position of the Earth and of Solar Orbiter at the event (bottom left panel); the STIX level curves reconstructed by CLEAN (bottom middle panel); and the STIX level curves reconstructed by multiscale CLEAN (bottom right panel). All level curves are superimposed onto the AIA map. The HXI observations are made in the 06:31:02–06:31:42 UT time interval and for the 25–50 keV energy channel for the first event; in the 12:10:00–12:11:00 UT time interval and for the 22–50 keV energy channel for the second event; andin the 12:46:45–12:47:00 UT time interval and for the 35–55 keV energy channel for the third event.
Current usage metrics show cumulative count of Article Views (full-text article views including HTML views, PDF and ePub downloads, according to the available data) and Abstracts Views on Vision4Press platform.
Data correspond to usage on the plateform after 2015. The current usage metrics is available 48-96 hours after online publication and is updated daily on week days.
Initial download of the metrics may take a while.