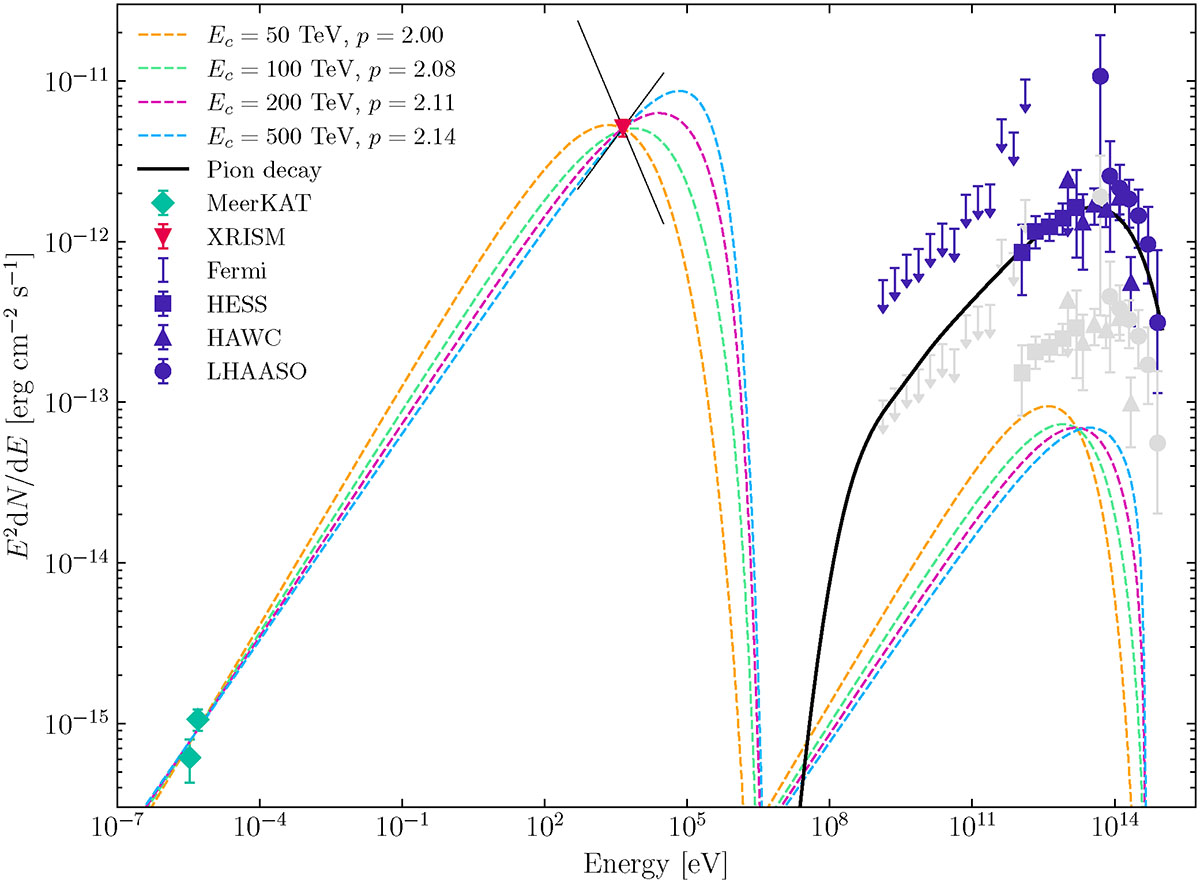
Fig. 4.
Download original image
Broadband spectral energy distribution. Emission from the central 10′ around V4641 Sgr is shown (coincident MeerKAT and XRISM detections), together with Fermi-LAT, H.E.S.S., HAWC and LHAASO spectra (Suzuki et al. 2025; Neronov et al. 2025; H.E.S.S. Collaboration 2025; Alfaro et al. 2024; LHAASO Collaboration 2025) at larger scales (∼1°). The gray points correspond to gamma-ray fluxes, scaled down to the XRISM source region by relative area. Synchrotron and IC models (dotted lines), as well as the pion decay model (black solid line) are overlaid.
Current usage metrics show cumulative count of Article Views (full-text article views including HTML views, PDF and ePub downloads, according to the available data) and Abstracts Views on Vision4Press platform.
Data correspond to usage on the plateform after 2015. The current usage metrics is available 48-96 hours after online publication and is updated daily on week days.
Initial download of the metrics may take a while.