| Issue |
A&A
Volume 706, February 2026
|
|
|---|---|---|
| Article Number | A283 | |
| Number of page(s) | 11 | |
| Section | Astrophysical processes | |
| DOI | https://doi.org/10.1051/0004-6361/202557124 | |
| Published online | 17 February 2026 | |
Large-scale radio bubbles around the black hole transient V4641 Sgr
1
Université Paris Cité, Université Paris-Saclay, CEA, CNRS, AIM F-91191 Gif-sur-Yvette, France
2
Astrophysics, Department of Physics, University of Oxford Keble Road Oxford OX1 3RH, UK
3
Department of Astronomy, University of Cape Town Private Bag X3 Rondebosch 7701, South Africa
4
Department of Physics and Electronics, Rhodes University PO Box 94 Makhanda 6140, South Africa
5
South African Radio Astronomy Observatory, 2 Fir Street Black River Park Observatory 7925, South Africa
6
INAF-Osservatorio Astronomico di Roma Via Frascati 33 I-00078 Monte Porzio Catone (RM), Italy
7
Istituto Nazionale di Astrofisica, Osservatorio Astronomico di Brera via E. Bianchi 46 23807 Merate (LC), Italy
★ Corresponding author: This email address is being protected from spambots. You need JavaScript enabled to view it.
Received:
5
September
2025
Accepted:
18
December
2025
Abstract
Context. Black holes (BHs) in microquasars can launch powerful relativistic jets that have the capacity to travel up to several parsecs from the compact object and interact with the interstellar medium. Recently, the detection of large-scale very-high-energy (VHE) gamma-ray emission around the black hole transient V4641 Sgr and other BH-jet systems suggested that jets from microquasars may play an important role in the production of galactic cosmic rays.
Aims. V4641 Sgr is known for its superluminal radio jet discovered in 1999, but no radio counterpart of a large-scale jet has been observed. The goal of this work is to search for a radio counterpart of the extended VHE source.
Methods. We observed V4641 Sgr with the MeerKAT radio telescope at the L and UHF bands and produced deep maps of the field using high dynamic range techniques.
Results. We report the discovery of a large-scale (∼35 pc), bow-tie-shaped, diffuse, radio structure around V4641 Sgr, with similar angular size to the extended X-ray emission discovered by XRISM. However, it is not spatially coincident with the extended VHE emission. After discussing the association of the structure with V4641 Sgr, we investigate the nature of the emission mechanism. We suggest that the bow-tie structure arose from the long-term action of large-scale jets or disk winds from V4641 Sgr. If the emission mechanism is of synchrotron origin, the radio/X-ray extended structure implies acceleration of electrons up to more than 100 TeV as far as tens of parsecs from the black hole.
Key words: accretion / accretion disks / black hole physics / relativistic processes / ISM: jets and outflows / X-rays: binaries
© The Authors 2026
 Open Access article, published by EDP Sciences, under the terms of the Creative Commons Attribution License (https://creativecommons.org/licenses/by/4.0), which permits unrestricted use, distribution, and reproduction in any medium, provided the original work is properly cited.
This article is published in open access under the Subscribe to Open model. This email address is being protected from spambots. You need JavaScript enabled to view it. to support open access publication.
1. Introduction
Relativistic jets are an ubiquitous facet of accretion onto compact objects, from stellar-mass black holes (BHs) to supermassive black holes (SMBHs). They release a large amount of the accreted power back to their environment, energizing the interstellar medium and influencing galactic evolution. In BH low-mass X-ray binaries (BH LMXBs), a companion star feeds a hot accretion disk surrounding the BH via Roche lobe overflow. In this configuration, the compact object is able to convert a significant fraction of the infalling material into powerful relativistic outflows on a wide range of scales. Such systems, nicknamed microquasars, are considered as smaller analogs of active galactic nuclei (AGNs).
While LMXBs spend most of their time in quiescence, they occasionally enter outburst phases during which their accretion rate and X-ray luminosity increase by several orders of magnitude. During an outburst, the system usually cycles through different accretion states defined by specific spectral and timing properties (Homan & Belloni 2005; Remillard & McClintock 2006; Belloni & Motta 2016). During transitions between accretion states, discrete ejecta, in the form of bipolar, relativistic plasma bubbles, can be launched (e.g., Corbel et al. 2004; Fender et al. 2004; Miller-Jones et al. 2012). These transient jets often display apparent superluminal motion and they have been historically observed at sub-parsec scales (e.g., GRS 1915+105, GRO J1655–40; Mirabel & Rodríguez 1994; Hjellming & Rupen 1995). The associated radio emission is characteristic of radiation from particles accelerated at long-lived shocks (Fender et al. 2023; Cooper et al. 2025; Matthews et al. 2025; Savard et al. 2025). For some sources, these transient jets can persist out to parsec-scales when they interact with the interstellar medium (ISM). Furthermore, recurrent outbursts (and thus jet production) have been shown to produce parsec-scale lobes, as seen in the case of 1E 1740.7–2942 (Mirabel et al. 1992) and GRS 1758-258 (Mirabel & Rodríguez 1999; Martí et al. 2017). Emission from large-scale discrete ejecta has also been detected up to X-rays in several systems, such as XTE J1550–564 (Corbel et al. 2002; Tomsick et al. 2003; Kaaret et al. 2003; Migliori et al. 2017), H 1743–322 (Corbel et al. 2005) and MAXI J1820+070 (Espinasse et al. 2020), implying particle acceleration up to ∼10 TeV. Over the last few years, observations carried out with the MeerKAT and ATCA arrays have revealed the omnipresence of large-scale jets from BH LMXB, including MAXI J1535–571 (Russell et al. 2019), MAXI J1820+070 (Bright et al. 2020; Espinasse et al. 2020), MAXI J1348–630 (Carotenuto et al. 2021), MAXI J1848–015 (Bahramian et al. 2023), and 4U 1543–47 (Zhang et al. 2025), hinting that all BH LMXBs are probably microquasars.
Jets appear to be essential in the dynamics of the overall accretion flow in BH systems and are thought to be the main channel for the transfer of accretion energy to the surrounding environment (Fender & Muñoz-Darias 2016). Recently, the detection of very-high-energy (VHE) gamma-ray emission associated with BH-jet systems demonstrated that stellar-mass BHs and their environments can operate as extremely efficient accelerators of particles, suggesting that large-scale jets from BHs could be a notable source of galactic cosmic rays (Alfaro et al. 2024; LHAASO Collaboration 2025), as previously proposed by Fender et al. (2005) and Cooper et al. (2020). Among these microquasars, the black hole X-ray binary V4641 Sgr was the brightest (by an order of magnitude) and displayed extended gamma-ray emission with one of the hardest spectra, continuing up to 0.8 PeV.
V4641 Sagitarii (V4641 Sgr) is a low-mass1 X-ray binary hosting a black hole with a mass of 6.4 ± 0.6 M⊙ and a B9III stellar companion with a mass of 2.9 ± 0.4 M⊙ (MacDonald et al. 2014). This transient, located at a parallax distance of 6.2 ± 0.7 kpc (MacDonald et al. 2014; Gandhi et al. 2019) was discovered in 1999 by BeppoSAX (in ’t Zand et al. 1999) and RXTE (Markwardt et al. 1999) when it exhibited a bright X-ray flare, although an outburst in 1978 was found on photographic plates decades later (Barsukova et al. 2014). A radio counterpart was identified by Hjellming et al. (2000) and revealed short-lived relativistic jets. The highly superluminal motion (∼10c) of these discrete ejecta (which is notably a matter of debate; e.g., Martí & Luque-Escamilla 2026) would imply a low jet inclination angle (≲10°), while strong ellipsoidal variations were found to indicate a high orbital axis inclination angle (≳60°; Orosz et al. 2001), suggesting a strong spin-orbit misalignment (Maccarone 2002; Salvesen & Pokawanvit 2020). Since 1999, V4641 Sgr has been observed in outburst every one to three years, always exhibiting short bursting activity. In September 2024, a new outburst was detected by MAXI (Negoro et al. 2024), while a small radio flare was observed by MeerKAT a month later (Grollimund et al. 2024).
The detection of a 1–2° jet-like gamma-ray structure around V4641 Sgr by HAWC (Alfaro et al. 2024), LHAASO (LHAASO Collaboration 2025), and H.E.S.S. (H.E.S.S. Collaboration 2025) suggests that particle acceleration beyond 1 PeV (if hadronic) takes place at similar distances from the black hole as the well-known microquasar SS 433 (Abeysekara et al. 2018; H.E.S.S. Collaboration 2024). Furthermore, recent X-ray observations with XRISM indicate the presence of another extended component located closer to V4641 Sgr (Suzuki et al. 2025). The spatial extent of this structure (radius of 7′±3′) is much smaller than the size of the gamma-ray bubble, hinting that the X-rays are produced by a population of electrons closer to the black hole than the particle acceleration sites responsible for the gamma-ray emission.
In this work, we report on the discovery of a large-scale (20′ in diameter, i.e., 35 pc) radio structure around V4641 Sgr in deep MeerKAT observations. This paper is structured as follows. Section 2 details the observations and data reduction we carried out, Sect. 3 presents the structure we found in the final radio map, Sect. 4 offers a discussion of the emission mechanism, energetics, and the possible association of this structure with large-scale jets or disk winds. Section 5 presents out conclusions.
2. Observations and data reduction
We observed V4641 Sgr in radio with the MeerKAT telescope from 2020 to 2024 as part of the ThunderKAT Large Survey Project (Fender et al. 2018) and X-KAT large MeerKAT open-time program. Most of the observing runs took place on a weekly cadence, during the 2021-2022 and 2024 outbursts (see Table A.1), using L-band receivers (856–1712 MHz). We also performed a 1-h UHF-band (544–1088 MHz) observation of the source. The correlator was configured to deliver either 4096 or 32768 channels across the total bandwidth, which were binned down to 1024 channels, with an 8-second integration time per visibility point. We used PKS J1939–6342 as a primary calibrator to set the absolute flux and bandpass, and J1833–2103 as a phase calibrator to perform a complex gain calibration. Each run consisted of a single 15-min scan or several 30-min scans of V4641 Sgr, interleaved by 2-min scans of the phase calibrator, as well as a single 10-min scan of the primary calibrator.
We reduced and imaged each of the 32 observations using the OXKAT2 data reduction scripts (Heywood 2020). The visibilities were initially flagged and calibrated using the Common Astronomy Software Application package (CASA; McMullin et al. 2007). Additional flagging on the target data was conducted using the TRICOLOUR3 package (Hugo et al. 2022). All imaging was done using WSCLEAN (Offringa et al. 2014) with a Briggs weighting scheme (robust parameter of 0.2 to maximize sensitivity). We generated full-band, multifrequency synthesis (MFS) images by deconvolving in eight sub-bands and convolving the resulting model image with a 8″ circular gaussian. After a step of direction-independent self-calibration with the CUBICAL package (Kenyon et al. 2018), the target was imaged a second time using masked deconvolution.
When imaging the square-degree MeerKAT field, the presence of two bright (∼0.3–1 Jy) sources4 resulted in severe artifacts. Thus, we peeled these sources from each observation to improve the dynamic range of the final map. To this end, we generated a model of the field with higher angular and frequency resolution using WSCLEAN and partitioned it into another FITS cube containing only the bright sources. We then predicted model visibilities from this cube, which we uv-subtracted from the model visibilities of the full sky using CUBICAL. We imaged the longest observation (4h on-source) and used the resulting map to generate a refined cleaning mask. After the peeling stage, the L-band data were combined and imaged using WSCLEAN, reaching a total exposure of ∼11 h. The residual artifacts were further mitigated by removing 160 of the 1024 spectral channels, as we noticed that these mainly originated from the upper edge of the band. The final L-band (central frequency of 1.217 GHz) and UHF-band (816 MHz) continuum images were then analyzed using the Cube Analysis and Rendering Tool for Astronomy (CARTA).
3. Results
3.1. Large-scale bow-tie structure
The L-band MeerKAT wide-field image of V4641 Sgr is presented in Fig. 1. In this map, a large-scale, faint, bow-tie-shaped structure resides close to the pointing center. This extended emission, which is roughly symmetric and spreads across ∼10′ NW and SE of V4641 Sgr, was not previously known. The low surface brightness (≲50 μJy beam−1) and angular scale of the diffuse emission make a detection challenging. MeerKAT was able to detect the structure thanks to its excellent uv-coverage5 and sensitivity, while most radio interferometers would likely resolve it out. In the UHF band, the bow-tie can also be detected and it has a very similar shape, providing evidence that the structure is real and does not arise from imaging artifacts.
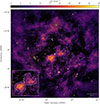 |
Fig. 1. V4641 Sgr field as observed by the MeerKAT interferometer in the L band (central frequency of 1.217 GHz), with an angular resolution of 8″. The background noise level is 4 μJy beam−1, while the noise level in the region surrounding the bow-tie is on the order of 10 μJy beam−1. The position of V4641 Sgr is marked by a black dot inside a white circle. The inset shows the central region of the field, with the bow-tie outlined in white. The white arrow indicates the proper motion of V4641 Sgr with respect to nearby stars, in the north-northeastern (NNE) direction (position angle of 15° E of N; see Sect. 3.2). |
To estimate the integrated flux density of the bow-tie structure, we first subtracted the point-like sources in the image plane. Indeed, the V4641 Sgr field is dominated by compact sources, including background and foreground sources which would erroneously increase the flux measurement if not subtracted. We then computed the flux density of the extended feature by integrating the brightness over two ellipsoidal regions (one for each side of the bow-tie) and obtained Sν = 87 ± 13 mJy at 1.217 GHz and Sν = 75 ± 26 mJy at 816 MHz, where the uncertainties are mostly due to the choice of extraction regions. This yields a UHF/L-band spectral index of αr = 0.37 ± 0.95. We note that the systematic subtraction of the point sources might be too drastic; for instance, if some of the compact sources were actually related to the extended emission. In such cases, the flux values we obtained would be underestimated.
Interestingly, the structure we discovered is spatially coincident (same position and angular size) with the extended X-ray emission around V4641 Sgr reported by Suzuki et al. (2025), who found a radius of 7′±3′. This is especially relevant given that this value was extracted from a one-dimensional (1D) radial profile, while an angular distance of 10′ from the black hole would align with the edges of the bow-tie.
In Fig. 2, we show the MeerKAT map with the H.E.S.S. (0.8–22 TeV) contours overlaid. A similar figure with HAWC contours can be found in Appendix B. We did not find any clear radio counterpart to the extended gamma-ray sources reported by Alfaro et al. (2024), LHAASO Collaboration (2025) and H.E.S.S. Collaboration (2025). The angular size of the radio structure (∼20′) is smaller than the gamma-ray jet-like features (∼1°) and its orientation in the plane of the sky is different (position angle of ∼ − 50°, while the gamma-ray bubble is roughly aligned with the N-S direction). When considering a model with two point sources, Alfaro et al. (2024) found a northern and a southern component, with angular separations to the black hole of 0.23° and 0.46°, respectively. Interestingly, the positions of these components correspond to “radio cavities”, namely, regions where the radio map is particularly free of diffuse emission (see Fig. B.1). It is also worth noting that a faint, arc-shaped region lies directly NE of the northern gamma-ray bubble, as seen in Figs. 2 and B.1. Although we cannot confirm a direct association with the structures detected by H.E.S.S. and HAWC, it remains plausible that this region traces an edge-brightened bow shock around the gamma-ray bubble.
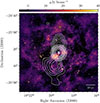 |
Fig. 2. V4641 Sgr field as observed by the MeerKAT interferometer in the L band, along with H.E.S.S. gamma-ray contours (energy range of 0.8 to 22 TeV) at the levels of 3, 4, ..., 9σ (H.E.S.S. Collaboration 2025). The dashed circle and the shaded area represent the radius of the XRISM X-ray source and its uncertainty (Suzuki et al. 2025). |
3.2. Proper motions of stars in the vicinity of V4641 Sgr
The position, parallax, and proper motion of ∼1.46 billion optical sources have been measured by the Gaia space observatory. In this work, we rely on Gaia astrometric data to study the motion of V4641 Sgr with respect to stars in its vicinity. The underlying purpose of this is to discuss the association of the bow-tie with V4641 Sgr (see Sect. 4.1).
We queried the Gaia DR3 catalog using the ASTROQUERY6 Python package. Nearby stars were selected through a cone search centered on V4641 Sgr, followed by the exclusion of sources with parallaxes falling outside a defined narrow interval. In Fig. 3, we show the proper motion of stars within 3′ around V4641 Sgr, with parallaxes in the range p★ ± 2σp★, where p★ = 0.169 mas is the V4641 Sgr parallax measurement and σp★ = 0.026 mas is its uncertainty. The population is represented in the (μRA, μDec) plane, where μRA and μDec are the proper motions in the direction of increasing right ascension and declination, respectively. Another representation of the proper motion vectors is provided in Appendix C. The average proper motion within the sample is  ,
,  (dotted gray lines in Fig. 3), implying that this population of stars has a significant global motion toward the south-west. On the other hand, V4641 Sgr displays a rather slow motion in the plane of the sky (μRA, ★ = −0.78 ± 0.03 mas yr−1, μDec, ★ = 0.43 ± 0.02 mas yr−1, position angle of −61° E of N). As a result, its motion relative to nearby stars is Δμ★ = 5.31 ± 0.04 mas yr−1 toward the north-northeast (position angle of 15° E of N). We performed the same analysis with other selection radii (1′, 5′, 10′) and parallax intervals (p★ ± σp★, ± 3σp★) and found very similar results within uncertainties.
 |
Fig. 3. Proper motion of stars in the vicinity of V4641 Sgr, in the direction of increasing right ascension (x-axis) and declination (y-axis), as measured by Gaia. Only stars within a 3′ radius and a p★ ± 2σp★ parallax range are shown. The differential parallax between V4641 Sgr and individual stars is color-coded. The black star ★ corresponds to the optical counterpart of V4641 Sgr, while the dotted gray lines indicate the average proper motion in the sample. |
4. Discussion
4.1. Association with V4641 Sgr
In our MeerKAT image, V4641 Sgr appears to be located close to the center of symmetry of the bow-tie structure in the plane of the sky. In addition, the angular size of each lobe (∼10′) of this large-scale feature is similar to the radius of the X-ray extended emission (7 ± 3′) inferred by Suzuki et al. (2025), hinting that the radio and X-ray structures may be related. We note that V4641 Sgr is slightly offset (≲1′ towards NNE) from the apparent center of symmetry of the bow-tie. However, this could be explained by a proper motion effect: if the source has moved since it began producing the extended structure, it might no longer be positioned at the center of it. As discussed in Sect. 3.2, V4641 Sgr is moving in the NNE direction relative to the nearby stars, and hence, to a first approximation, similarly with respect to the surrounding ISM. This is precisely the direction of the offset between the XRB and the apparent center of the large-scale structure. As the bow-tie should move with the ISM, we conclude that a proper motion effect is a viable explanation for the offset. Then, if we trace the trajectory backwards in time, we find that V4641 Sgr was at the center of the bow-tie (i.e., ∼1′ away from its current position) about 10 kyrs ago. Alternatively, we could raise the possibility of inhomogeneities of the ISM density around the source, which would lead to variations in the radiative efficiency, which would, in turn, cause the apparent center of symmetry to be shifted towards the direction where the medium density is higher. Finally, the position angle of the 1999 radio jets (∼ − 18°; Hjellming et al. 2000) falls within the angular range of the bow-tie, since the latter has a mean axis tilted by ∼ − 50° E of N, along with an apparent opening angle of φ ≃ 80°. We note that the mean direction from V4641 Sgr to the brightest parts of the radio lobes (∼ − 70°) is significantly offset from the direction of the 1999 jets and this is a caveat. Thus, we assume hereafter that the radio and X-ray extended emission originate from the same large-scale structure, which we associate with past activity from V4641 Sgr.
4.2. Jet and wind scenarios
Large-scale collimated jets can generate persistent jet-like features or at least occasionally when interacting with the ISM, hotspots, and bow-shock regions. The bow-tie feature around V4641 Sgr is a large-scale, symmetric, diffuse structure, which is reminiscent of the radio lobes observed in other sources. If we assume that the radio and X-ray emission (which have similar spatial extent) are related, the global radio-to-X-rays spectral index α = −0.58 ± 0.02 is consistent with optically thin synchrotron emission from a plasma of relativistic electrons (see Sect. 4.3 for a discussion on the emission mechanism). Therefore, we suggest that the bow-tie structure is the result of the long-term action of large-scale jets from V4641 Sgr.
We did not identify any clear signature of an edge-brightened bow-shock that would correspond to the compressed material at the boundaries of a jet-blown cavity, as seen in Cyg X–1, GRS 1915+105, and GRS 1758–258 (Gallo et al. 2005; Atri et al. 2025; Motta et al. 2025; Martí et al. 2017; Mariani et al. 2025), or a supernova remnant around the X-ray binary, as seen in SS 433 and Cir X–1 (Clark & Murdin 1978; Clark et al. 1975; Heinz et al. 2013). Instead, we detected almost uniform, diffuse, extended emission around the source, which resembles the persistent jets in 4U 1755–33 (Angelini & White 2003; Kaaret et al. 2006), although we note that the latter have a more linear shape. Such emission, if it is indeed related to a large-scale jet, would imply efficient particle acceleration all along the jet, rather than at a jet termination shock. This is reminiscent of the morphology of FR I radio galaxies, which show gradual energy dissipation and particle acceleration along the outflow axis.
The conical shape of the structure is interesting in itself. The opening angle of the bow-tie, ψ, is given by tan(ψ/2) = tan(φ/2)sin θ, where φ ≃ 80° is the opening angle projected on the plane of the sky and θ is the angle between the symmetry axis of the bow-tie and the line of sight (i.e., the jet average inclination). Transient jets from X-ray binaries typically have measured opening angles of a few degrees (see, e.g., Miller-Jones et al. 2006). If θ is small, the real opening angle ψ is likely much smaller than 80°. If θ is larger, the observed structure might not be explained by a steady, fixed-axis outflow; instead, a precessing jet with a wide precession angle could, in principle, reproduce the bow-tie. Such a phenomenon has been observed in several microquasars, one of the best examples being the mas-scale precessing jets of SS 433 (e.g., Mioduszewski et al. 2003). Likewise, relativistic precessing jets in Cir X–1 have been inferred to explain the powering of large diffuse structures (Sell et al. 2010; Cowie et al. 2025, 2026) with a remarkably similar morphology (including the opening angle and physical size). The possibility of a precessing accretion flow around V4641 Sgr was already suggested by Gallo et al. (2014), who found rapid time-scale variability of a broad emission feature in the X-ray spectrum that could be explained by a variable “microblazar” behavior (see also Orosz et al. 2001; Chaty et al. 2003).
As highlighted in Sect. 3, the VHE gamma-ray bubble and bow-tie structure discovered by MeerKAT have different orientations in the plane of the sky (position angles of ∼0° and ∼ − 50° E of N, respectively). Additionally, a discrepancy in terms of angle to the line of sight has been suggested by Alfaro et al. (2024), who argued that the gamma-ray sources would be consistent with jets being perpendicular to the accretion disk (with an inclination angle i = 72.3 ± 4.1°; MacDonald et al. 2014), while the superluminal radio jet may be almost aligned with the line of sight (16°; Salvesen & Pokawanvit 2020). It has been proposed that the misalignment of the radio jet and the VHE extended structure could be explained by assuming that the latter is not directly linked to the jet. Instead, the gamma-ray feature could arise from high energy particles escaping at the jet termination (where the jet loses its stability) and streaming along the ordered magnetic field lines in the ISM (Neronov et al. 2025). In the jet scenario, the radio and X-ray extended emission is due to relativistic electrons producing synchrotron radiation. These electrons would cool quite quickly relative to protons, explaining why the low-energy structures have a lower spatial extent (∼20′) than the gamma-ray bubble (≳1°), which is probably of hadronic origin. Hence, the bow-tie would be caused by recent jet activity, while the VHE features would trace longer timescale energy input into the ISM.
Another possibility that could explain the formation of the bow-tie structure is related to disk winds. Optical spectroscopic studies revealed that V4641 Sgr produces strong wind outflows, detected during several outbursts (see, e.g., Chaty et al. 2003; Muñoz-Darias et al. 2018). In particular, observations taken after the 1999 peak flux implied outflow velocities of up to ∼3000 km s−1. These disk winds, which have been observed both in soft and hard states (i.e., even when the jet is active; Muñoz-Darias et al. 2018), can drive blast waves propagating through the surrounding medium, accelerating particles at the shock front. In the case of radio-quiet AGNs, it has been shown that synchrotron radiation from wind-driven shocks can be a strong source of radio emission (Stocke et al. 1992; Nims et al. 2015; Rankine et al. 2021; Richards et al. 2021). In LMXBs (particularly in a strong wind source such as V4641 Sgr) a similar phenomenon could be at play. The orientation of the disk winds is likely to differ from the direction of the jet, which could explain the discrepancy between the axes of the bow-tie and the gamma-ray bubble, without the need for a precessing jet. While the inclination of the system (72°), angle to the line of sight, and position angle of the superluminal jet (< 16° and −18° E of N) are known, we cannot constrain the angle of the disk normal in the plane of the sky due to the strong spin-orbit misalignment (Orosz et al. 2001; MacDonald et al. 2014). For an equatorial disk wind along the bow-tie axis, this angle would be on the order of 40° E of N.
4.3. Emission mechanism
Another key question is the nature of the emission mechanism. We plot in Fig. 4 the broadband spectral energy distribution (SED) of the extended emission around V4641 Sgr. While ultra-high-energy gamma-rays have been detected by H.E.S.S., HAWC, and LHAASO up to ∼1° from the X-ray binary, it is known that the X-ray and radio emission regions have a spatial extent of 7–10′. Thus, we can make the assumption that there exist two emission regions, which are not co-spatial and which are responsible for different parts of the SED. In this scenario, the two regions are associated with two populations of particles: hadrons at large distances from V4641 Sgr and leptons, closer to the black hole. In contrast, we note that a leptonic interpretation of the gamma-ray emission was proposed by Wan et al. (2025) and H.E.S.S. Collaboration (2025), but we do not discuss this notion here.
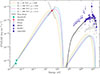 |
Fig. 4. Broadband spectral energy distribution. Emission from the central 10′ around V4641 Sgr is shown (coincident MeerKAT and XRISM detections), together with Fermi-LAT, H.E.S.S., HAWC and LHAASO spectra (Suzuki et al. 2025; Neronov et al. 2025; H.E.S.S. Collaboration 2025; Alfaro et al. 2024; LHAASO Collaboration 2025) at larger scales (∼1°). The gray points correspond to gamma-ray fluxes, scaled down to the XRISM source region by relative area. Synchrotron and IC models (dotted lines), as well as the pion decay model (black solid line) are overlaid. |
Due to significant uncertainties on the flux measurements, the radio spectral index is not well constrained (αr = 0.37 ± 0.95): within the error bars, it is consistent with both optically thin free-free (flat spectrum) and optically thin synchrotron radiation (α < 0). If, instead, we include both the radio and X-rays, we obtain a spectral index of α = −0.58 ± 0.02, which is typically expected in the case of synchrotron emission from an optically thin plasma and is only 1σ from αr.
4.3.1. Synchrotron
To test the synchrotron hypothesis, we tentatively performed SED fitting using the NAIMA7 package (Zabalza 2015) with the following model:
-
A population of relativistic electrons radiates through synchrotron and inverse Compton (IC) scattering of soft photons;
-
A population of relativistic protons produces gamma-rays through p-p interactions followed by pion decay;
-
Each of these populations follows a power-law distribution with an exponential cut-off:

where p is the distribution index, E0 the reference point energy, Ec the cut-off energy, and k a normalization factor.
We first fitted a synchrotron model to the radio and X-ray fluxes from the extended sources, inferring an electron distribution. Since the available data are insufficient to constrain the exponential cut-off, we fixed the value of the magnetic field to B = 20 μG (an average value from Suzuki et al. 2025) and fitted the model for different cut-off energies, Ec ∈ [50, 100, 200, 500] TeV. We then computed the expected IC flux from the same region assuming the inferred electron distribution. We finally fitted a pion decay model to the gamma-ray fluxes (larger region), inferring a proton distribution. The results are shown in Fig. 4. The set of parameters (B, Ec) we have examined allows to reproduce the observed radio and X-ray fluxes with a synchrotron model. We find an electron distribution index of p ∼ 2.1, in agreement with the value of α determined above, as α = (1 − p)/2 ≃ −0.55 in the case of optically thin synchrotron radiation. Assuming this electron distribution, the computed IC flux is lower than the measured gamma-ray flux, even when the latter is scaled down to the radio/X-ray source region by relative area (gray points), as shown in Fig. 4. Under our assumptions, this is consistent with the need for a hadronic mechanism for the VHE emission in the central 10′ (i.e., where radio, X-ray, and VHE emissions are all detected). We note that the inferred electron distribution (and, thus, the IC flux) depends on the magnetic field, which we have fixed to B = 20 μG. A caveat is that a low magnetic field would imply a much higher IC flux. In that case, determining the VHE emission mechanism (which is beyond the scope of this paper) is actually not trivial. Indeed, a sharp increase in IC flux would imply a leptonic contribution to the VHE emission. For illustrative purposes, we assume a hadronic origin. Fitting the pion decay model to the gamma-ray data gives a proton distribution index of  and a cut-off energy of
  , consistent with the PeVatron nature of the source, as suggested by previous studies (Alfaro et al. 2024; LHAASO Collaboration 2025; Neronov et al. 2025).
Let us assume that the radio/X-ray spectrum arises from optically thin synchrotron emission from a relativistic plasma of electrons. We can derive a minimum energy associated with this plasma, which occurs close to equipartition between energies in electrons and magnetic field (see Longair 2011). A detailed view on the computation of the minimum energy and the equipartition field is provided in Appendix D. We used a frequency range of ν1 = 1.2 × 10⁹ Hz to ν2 = 2.4 × 10¹⁸ Hz with a spectral index of α = (1 − p)/2 = −0.6 and a flux density of Sν0 = 45.4 nJy at the pivot frequency of ν0 = 4.2 × 10¹⁷ Hz. This gives an integrated luminosity of 8.1 × 1034 erg s−1.
To estimate the volume of the bow-tie structure, we assumed a conical geometry, as shown in Fig. 5. This is motivated by the shape of the radio structure and the possible association of the latter with a large-scale jet (see Sect. 4.2 for a discussion). When placing V4641 Sgr at the vertex of a cone, we measure a height of 10′ and a radius of 6′, which corresponds (at 6.2 kpc) to physical scales of H ≃ 18(sin θ)−1 pc and R ≃ 11 pc, respectively, and a total volume of V = 1.3 × 1059(sin θ)−1 cm3. Finally, we assume η = 1 (see Appendix D) for consistency with similar studies, and a filling factor f = 0.5. We find an equipartition field of Beq = 5.8(sin θ)2/7 μG and a corresponding minimum total energy of Emin = 2.1 × 1047(sin θ)−3/7 erg. To produce the observed X-ray emission, electrons in a magnetic field Beq need a Lorentz factor of γ = 2.6 × 10⁸. Thus, electrons within the large-scale bow-tie structure are accelerated up to 130 TeV and have a cooling timescale of 2.9 kyrs in the absence of adiabatic cooling. This also leads to an estimate for the number of electrons of 7.5 × 1048 and, assuming a proton-electron plasma, a total mass of 1.3 × 1025 g. The above physical quantities also depend on sin θ to a negative power and are thus lower limits.
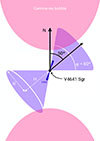 |
Fig. 5. Schematic illustration of the bow-tie around V4641 Sgr in the plane of the sky. In our model, the geometry of the bow-tie is a cone of radius, R, and height, H, with V4641 Sgr at its vertex. The symmetry axis of the cone has a position angle of −50° E of N. φ is the projected opening angle of the structure. The black dot corresponds to the position of V4641 Sgr, while the direction of the 1999 radio jets (−18° E of N; Hjellming et al. 2000) is represented in dark blue. The pink shaded areas symbolize the gamma-ray bubbles (Alfaro et al. 2024; LHAASO Collaboration 2025; H.E.S.S. Collaboration 2025). |
To check whether a jet scenario is realistic, we compare tentative estimations of the jet age and accretion timescales. A lower limit on the age of the structure can be determined by assuming that the bow-tie expands at 10% of the speed of light as a typical terminal speed measured in other systems (e.g., Sco X–1, XTE J1550–564; Fomalont et al. 2001a,b; Migliori et al. 2017), keeping in mind the true expansion velocity is likely smaller. For an angular size of 10′ (i.e., ∼18(sin θ)−1 pc at D = 6.2 kpc) on either side of V4641 Sgr, this gives a minimum jet age of ∼590(sin θ)−1 yr. A more reasonable value would be the synchrotron cooling time of the high energy electrons (i.e., 2.9 kyrs) derived above using synchrotron minimum energy arguments. Lastly, the travel time of V4641 Sgr, from the center of the bow-tie to its current position, gives a modestly higher value of ∼10 kyrs (see Sect. 4.1). On the other hand, the minimum energy stored in the relativistic plasma requires a total mass of 1.3 × 1025 g. The required energy corresponds to ∼8 yrs’ accumulation at the Eddington rate for a 6.4 M⊙ black hole, while the mass could be accumulated in ∼160 days. V4641 Sgr is active every 1–3 years, but its outbursts are much shorter than typical BH LMXBs (e.g., Maitra & Bailyn 2006), making its duty cycle rather low. Taking an average value of 2 years for the recurrence time and 10 days for the outburst mean duration, the energy accumulation time converts to ∼600 yr; namely, this is roughly five times smaller than the synchrotron cooling time and almost equal to the expansion time at 0.1c. We thus conclude that the estimated age of the structure is compatible with the energy accumulation time, demonstrating the plausibility of the jet scenario in terms of timescales.
In the wind scenario, we can assume a similar energy budget, although in that case the expansion time will be much higher. Even with a wind speed of 3000 km s−1 (Muñoz-Darias et al. 2018), the expansion time is as high as ∼5.9 kyrs (i.e., ∼twice the synchrotron cooling time), making the wind scenario less probable than the jet scenario in the synchrotron framework.
4.3.2. Free-free
The bow-tie is reminiscent of the smaller scale “ruff” of equatorial emission that surrounds SS 433 (Paragi et al. 1999, 2002; Blundell et al. 2001), as well as the parsec-scale faint diffuse structure recently observed around Cir X–1 (Cowie et al. 2025). In the case of SS 433, the ruff was interpreted as thermal bremsstrahlung emission from a wind-like outflow, either from the companion, the accretion disk (Blundell et al. 2002), or a circumbinary disk (Blundell et al. 2008; Doolin & Blundell 2009). Similarly, the large-scale radio structure around V4641 Sgr could arise from free-free emission produced by a disk wind. V4641 Sgr has exhibited at least one super-Eddington outburst (Revnivtsev et al. 2002), implying significant radiatively driven mass-loss, likely in the form of equatorial disk winds. The free-free hypothesis implies to break the association between the radio and X-rays.
The bremsstrahlung spectral emissivity, εν, is related to the electron density, ne, and temperature, T. Hence, we can use the flux density measurement and a range of temperatures to estimate whether reasonable ambient conditions can reproduce the observed emission. The electron density is expressed as
![Mathematical equation: $$ \begin{aligned} n_e = \left[ \frac{\varepsilon _\nu T^{1/2} \exp (h\nu /k_B T)}{\kappa g(\nu , T)} \right]^{1/2}, \end{aligned} $$](/articles/aa/full_html/2026/02/aa57124-25/aa57124-25-eq6.gif)
where κ ≃ 6.84 × 10−38 erg s−1 Hz−1 cm3 K1/2 and g(ν, T) is the Gaunt factor (see Appendix E for a more detailed treatment). An average emissivity can be derived using the measured spectral luminosity, Lν, and a emission volume, V, as εν = Lν/V = 4πD2Sν/V. We consider a temperature range of 104–107 K: below the lower bound, the gas is not fully ionized and, thus, cannot radiate efficiently through bremsstrahlung. These temperatures give Gaunt factors in the range 6–12 and constrain the electron density between 2 and 11 cm−3 (modulated by a factor of (sin θ)1/2), which are typical values in the ISM. We therefore conclude that bremsstrahlung radiation is able to produce the observed radio luminosity under reasonable ambient conditions.
In the context of radio-quiet quasars, Blundell & Kuncic (2007) developed a model for the core radio emission, in which thermal disk winds contribute to the flat radio spectrum through optically thin free-free radiation. This model predicts the specific radio luminosity as a function of the mass outflow rate, ṁw, wind velocity, vw, and electron temperature, T, expressed as
where μ is the mean molecular weight of the plasma, mp is the mass of the proton, fΩ = Ω/4π is the geometrical covering factor of the outflow8 and rph is the photospheric radius, namely, the radius beyond which the wind becomes transparent (Blundell & Kuncic 2007). From both theory and observation, thermal disk winds in BH LMXBs likely have mass loss rates similar to the accretion rate (e.g., Woods et al. 1996; Ponti et al. 2012; Fender & Muñoz-Darias 2016; Higginbottom et al. 2019). Hence, at Eddington rate, we have ṁw ≃ ṁEdd = 9 × 10¹⁷ g s−1. At this mass rate, the relevant expression for the photospheric radius is the free-free absorption radius,
where A = (κc2/24πkB)1/3 ≃ 0.18 cm5/3Hz2/3K1/2. Using the expression for rph, the spectral luminosity becomes
Previous studies have measured wind terminal velocities in the range 900–1600 km s−1 (e.g., Muñoz-Darias et al. 2018); thus, we chose vw = 1000 km s−1. Finally, we estimated fΩ = 0.3 from the opening angle of the bow-tie. At ν = 1.2 GHz and assuming a fully ionized hydrogen plasma (μ = 0.5), the resulting spectral luminosity is Lν = (2.3 − 3.4)×1015 erg s−1 Hz−1 for the same temperature range as above. On the other hand, we were able to extract the luminosity of the bow-tie from our observations and found Lν = 4πD2Sν ≃ 4.0 × 10²¹ erg s−1 Hz−1. This measurement is six orders of magnitude higher than the theoretical value, indicating that the model does not successfully explain the radio luminosity. Even with super-Eddington accretion (e.g., ṁ = 10 ṁEdd) and disk winds with velocities reduced by a factor of 10, the expected luminosity is still off by a factor of 2000. This result argues against a “pure wind” origin, namely, a continually replenished wind plasma emitting via optically thin free-free emission.
An estimate of the total energy input by a potential jet or wind can be computed using the enthalpy of the region, since it encapsulates the internal energy of the gas and the work done in blowing the bow-tie. For an ideal non-relativistic gas, the enthalpy is given by H = 5PV/2, while the pressure can be expressed as P = nekBT. For the same range in temperature (104–107 K), we find the pressure to be P = 3.2 × 10⁻¹² − 1.3 × 10⁻⁸ erg cm−3 and the enthalpy H = 1.2 × 1048 − 4.9 × 1051 erg (modulated by a factor of (sin θ)−1). At the Eddington rate, these energies could be accumulated in ∼0.05–190 kyrs, which converts into ∼3.4 kyrs–14 Myrs when considering the same duty cycle as in Sect. 4.3.1 (10 days of activity every 2 years). These energies (and timescales) are between one and three orders of magnitude higher than those derived when considering synchrotron, further decreasing the likelihood that free-free is the dominant emission mechanism.
5. Conclusions
We report the discovery of a faint, symmetric, large-scale (∼35 pc) radio structure around the black hole X-ray binary V4641 Sgr, revealed through deep MeerKAT observations. This extended emission exhibits a bow-tie morphology and spatially coincides with X-ray emission previously detected by XRISM. While synchrotron emission from relativistic electrons accelerated in past outflow activity offers the most self-consistent explanation for the observed radio and X-ray properties, we also explored a free-free emission scenario associated with a thermal disk wind. Although this mechanism is able to reproduce the radio flux under plausible physical conditions, it does not account for the X-ray emission and requires significantly higher energy input. The geometry and energetics favor an origin linked to large-scale jets from V4641 Sgr, although a contribution from equatorial disk winds cannot be fully excluded. No clear radio counterpart is found for the larger-scale TeV gamma-ray structure detected by HAWC and LHAASO, indicating distinct emission regions and possibly different particle populations.
This detection adds V4641 Sgr to the growing population of black hole LMXBs exhibiting parsec-scale jets and extended emission, reinforcing the idea that microquasars can significantly impact their surrounding environment. Together with recent detections of VHE gamma-ray emission, these findings position V4641 Sgr as a promising laboratory to study particle acceleration and feedback processes from stellar-mass black holes.
Data availability
The MeerKAT map shown in Figure 1 is available at the CDS via https://cdsarc.cds.unistra.fr/viz-bin/cat/J/A+A/706/A283.
Acknowledgments
We thank the referee for their careful reading and very fruitful comments, in particular regarding the proper motion study. The MeerKAT telescope is operated by the South African Radio Astronomy Observatory, which is a facility of the National Research Foundation, an agency of the Department of Science, Technology and Innovation. We acknowledge the use of the ilifu cloud computing facility – www.ilifu.ac.za, a partnership between the University of Cape Town, the University of the Western Cape, Stellenbosch University, Sol Plaatje University, the Cape Peninsula University of Technology and the South African Radio Astronomy Observatory. The ilifu facility is supported by contributions from the Inter-University Institute for Data Intensive Astronomy (IDIA - a partnership between the University of Cape Town, the University of Pretoria and the University of the Western Cape), the Computational Biology division at UCT and the Data Intensive Research Initiative of South Africa (DIRISA). This work made use of the CARTA (Cube Analysis and Rendering Tool for Astronomy) software (DOI 10.5281/zenodo.3377984 – https://cartavis.github.io). JHM acknowledges funding from a Royal Society University Research Fellowship (URF\R1\221062). The authors would like to thank Lilia Tremou, Andrew Hughes, Francesco Carotenuto and Payaswini Saikia for scheduling the MeerKAT observations and Fraser Cowie for providing access to the archival ThunderKAT data. Finally, we thank Pierre Kervella for his kind assistance with the Gaia astrometric data.
References
- Abeysekara, A. U., Albert, A., Alfaro, R., et al. 2018, Nature, 562, 82 [CrossRef] [Google Scholar]
- Alfaro, R., Alvarez, C., Arteaga-Velázquez, J. C., et al. 2024, Nature, 634, 557 [Google Scholar]
- Angelini, L., & White, N. E. 2003, ApJ, 586, L71 [Google Scholar]
- Atri, P., Motta, S. E., van den Eijnden, J., et al. 2025, A&A, 696, A223 [NASA ADS] [CrossRef] [EDP Sciences] [Google Scholar]
- Bahramian, A., Tremou, E., Tetarenko, A. J., et al. 2023, ApJ, 948, L7 [Google Scholar]
- Barsukova, E., Goranskij, V., & Kroll, P. 2014, Astroplate, 2014, 99 [Google Scholar]
- Belloni, T. M., & Motta, S. E. 2016, Transient Black Hole Binaries (Berlin, Heidelberg: Springer, Berlin Heidelberg), 61 [Google Scholar]
- Blundell, K. M., & Kuncic, Z. 2007, ApJ, 668, L103 [NASA ADS] [CrossRef] [Google Scholar]
- Blundell, K. M., Mioduszewski, A. J., Muxlow, T. W. B., Podsiadlowski, P., & Rupen, M. P. 2001, ApJ, 562, L79 [NASA ADS] [CrossRef] [Google Scholar]
- Blundell, K. M., Rupen, M. P., Mioduszewski, A. J., Muxlow, T. W. B., & Podsiadlowski, P. 2002, in 4th Microquasar Workshop: Microquasars and their Relation to Other Jet Sources in the Universe [Google Scholar]
- Blundell, K. M., Bowler, M. G., & Schmidtobreick, L. 2008, ApJ, 678, L47 [NASA ADS] [CrossRef] [Google Scholar]
- Bright, J. S., Fender, R. P., Motta, S. E., et al. 2020, Nat. Astron., 4, 697 [NASA ADS] [CrossRef] [Google Scholar]
- Carotenuto, F., Corbel, S., Tremou, E., et al. 2021, MNRAS, 504, 444 [NASA ADS] [CrossRef] [Google Scholar]
- Chaty, S., Charles, P. A., Martí, J., et al. 2003, MNRAS, 343, 169 [NASA ADS] [CrossRef] [Google Scholar]
- Clark, D. H., & Murdin, P. 1978, Nature, 276, 44 [NASA ADS] [CrossRef] [Google Scholar]
- Clark, D. H., Parkinson, J. H., & Caswell, J. L. 1975, Nature, 254, 674 [Google Scholar]
- Cooper, A. J., Gaggero, D., Markoff, S., & Zhang, S. 2020, MNRAS, 493, 3212 [Google Scholar]
- Cooper, A. J., Matthews, J. H., Carotenuto, F., et al. 2025, MNRAS, 541, 3518 [Google Scholar]
- Corbel, S., Fender, R. P., Tzioumis, A. K., et al. 2002, Science, 298, 196 [Google Scholar]
- Corbel, S., Fender, R. P., Tomsick, J. A., Tzioumis, A. K., & Tingay, S. 2004, ApJ, 617, 1272 [CrossRef] [Google Scholar]
- Corbel, S., Kaaret, P., Fender, R. P., et al. 2005, ApJ, 632, 504 [CrossRef] [Google Scholar]
- Cowie, F. J., Fender, R. P., Heywood, I., et al. 2025, MNRAS, 544, L37 [Google Scholar]
- Cowie, F. J., Fender, R. P., Heywood, I., et al. 2026, MNRAS, submitted [Google Scholar]
- Doolin, S., & Blundell, K. M. 2009, ApJ, 698, L23 [Google Scholar]
- Espinasse, M., Corbel, S., Kaaret, P., et al. 2020, ApJ, 895, L31 [NASA ADS] [CrossRef] [Google Scholar]
- Fender, R., & Muñoz-Darias, T. 2016, in Lecture Notes in Physics, eds. F. Haardt, V. Gorini, U. Moschella, A. Treves, & M. Colpi, (Berlin Springer Verlag) 905, 65 [NASA ADS] [CrossRef] [Google Scholar]
- Fender, R. P., Belloni, T. M., & Gallo, E. 2004, MNRAS, 355, 1105 [NASA ADS] [CrossRef] [Google Scholar]
- Fender, R. P., Maccarone, T. J., & van Kesteren, Z. 2005, MNRAS, 360, 1085 [Google Scholar]
- Fender, R., Woudt, P. A., Corbel, S., et al. 2018, PoS, MeerKAT2016, 013 [Google Scholar]
- Fender, R. P., Mooley, K. P., Motta, S. E., et al. 2023, MNRAS, 518, 1243 [Google Scholar]
- Fomalont, E. B., Geldzahler, B. J., & Bradshaw, C. F. 2001a, ApJ, 553, L27 [NASA ADS] [CrossRef] [Google Scholar]
- Fomalont, E. B., Geldzahler, B. J., & Bradshaw, C. F. 2001b, ApJ, 558, 283 [Google Scholar]
- Gallo, E., Fender, R., Kaiser, C., et al. 2005, Nature, 436, 819 [Google Scholar]
- Gallo, E., Plotkin, R. M., & Jonker, P. G. 2014, MNRAS, 438, L41 [Google Scholar]
- Gandhi, P., Rao, A., Johnson, M. A. C., Paice, J. A., & Maccarone, T. J. 2019, MNRAS, 485, 2642 [Google Scholar]
- Grollimund, N., Corbel, S., & Fender, R. 2024, ATel, 16852, 1 [Google Scholar]
- H.E.S.S. Collaboration (Aharonian, F., et al.) 2024, Science, 383, 402 [NASA ADS] [CrossRef] [Google Scholar]
- H.E.S.S. Collaboration (Acharyya, A., et al.) 2025, A&A, 706, A8 [Google Scholar]
- Heinz, S., Sell, P., Fender, R. P., et al. 2013, ApJ, 779, 171 [Google Scholar]
- Heywood, I. 2020, oxkat: Semi-automated imaging of MeerKAT observations, Astrophysics Source Code Library [record ascl:2009.003] [Google Scholar]
- Higginbottom, N., Knigge, C., Long, K. S., Matthews, J. H., & Parkinson, E. J. 2019, MNRAS, 484, 4635 [NASA ADS] [CrossRef] [Google Scholar]
- Hjellming, R. M., & Rupen, M. P. 1995, Nature, 375, 464 [NASA ADS] [CrossRef] [Google Scholar]
- Hjellming, R. M., Rupen, M. P., Hunstead, R. W., et al. 2000, ApJ, 544, 977 [Google Scholar]
- Homan, J., & Belloni, T. 2005, Ap&SS, 300, 107 [Google Scholar]
- Hugo, B. V., Perkins, S., Merry, B., Mauch, T., & Smirnov, O. M. 2022, in ASP Conference Series, eds. J. E. Ruiz, F. Pierfedereci, & P. Teuben, 532, 541 [Google Scholar]
- in ’t Zand, J., Heise, J., Bazzano, A., et al. 1999, IAU Circ., 7119, 1 [NASA ADS] [Google Scholar]
- Kaaret, P., Corbel, S., Tomsick, J. A., et al. 2003, ApJ, 582, 945 [Google Scholar]
- Kaaret, P., Corbel, S., Tomsick, J. A., et al. 2006, ApJ, 641, 410 [Google Scholar]
- Kenyon, J. S., Smirnov, O. M., Grobler, T. L., & Perkins, S. J. 2018, MNRAS, 478, 2399 [NASA ADS] [CrossRef] [Google Scholar]
- LHAASO Collaboration (Cao, Z., et al.) 2025, Nat. Sci. Rev., nwaf496 [Google Scholar]
- Longair, M. S. 2011, High Energy Astrophysics, 3rd edn. (Cambridge University Press) [Google Scholar]
- Maccarone, T. J. 2002, MNRAS, 336, 1371 [Google Scholar]
- MacDonald, R. K. D., Bailyn, C. D., & Cantrell, A. G. 2011, Am. Astron. Soc. Meeting Abstr., 217, 144.20 [Google Scholar]
- MacDonald, R. K. D., Bailyn, C. D., Buxton, M., et al. 2014, ApJ, 784, 2 [NASA ADS] [CrossRef] [Google Scholar]
- Maitra, D., & Bailyn, C. D. 2006, ApJ, 637, 992 [Google Scholar]
- Mariani, I., Motta, S. E., Atri, P., et al. 2025, A&A, 704, A239 [NASA ADS] [CrossRef] [EDP Sciences] [Google Scholar]
- Markwardt, C. B., Swank, J. H., & Marshall, F. E. 1999, IAU Circ., 7120, 1 [NASA ADS] [Google Scholar]
- Martí, J., & Luque-Escamilla, P. L. 2026, MNRAS, 545, staf2104 [Google Scholar]
- Martí, J., Luque-Escamilla, P. L., Bosch-Ramon, V., & Paredes, J. M. 2017, Nat. Commun., 8, 1757 [CrossRef] [Google Scholar]
- Matthews, J. H., Cooper, A. J., Rhodes, L., et al. 2025, MNRAS, 539, 2665 [Google Scholar]
- McMullin, J. P., Waters, B., Schiebel, D., Young, W., & Golap, K. 2007, in Astronomical Data Analysis Software and Systems XVI, eds. R. A. Shaw, F. Hill, & D. J. Bell, ASP Conf. Ser., 376, 127 [Google Scholar]
- Migliori, G., Corbel, S., Tomsick, J. A., et al. 2017, MNRAS, 472, 141 [NASA ADS] [CrossRef] [Google Scholar]
- Miller-Jones, J. C. A., Fender, R. P., & Nakar, E. 2006, MNRAS, 367, 1432 [NASA ADS] [CrossRef] [Google Scholar]
- Miller-Jones, J. C. A., Sivakoff, G. R., Altamirano, D., et al. 2012, MNRAS, 421, 468 [NASA ADS] [Google Scholar]
- Mioduszewski, A. J., Rupen, M. P., Walker, R. C., & Taylor, G. B. 2003, Am. Astron. Soc. Meeting Abstr., 203, 31.05 [Google Scholar]
- Mirabel, I. F., & Rodríguez, L. F. 1994, Nature, 371, 46 [Google Scholar]
- Mirabel, I. F., & Rodríguez, L. F. 1999, ARA&A, 37, 409 [Google Scholar]
- Mirabel, I. F., Rodriguez, L. F., Cordier, B., Paul, J., & Lebrun, F. 1992, Nature, 358, 215 [NASA ADS] [CrossRef] [Google Scholar]
- Motta, S. E., Atri, P., Matthews, J. H., et al. 2025, A&A, 696, A222 [NASA ADS] [CrossRef] [EDP Sciences] [Google Scholar]
- Muñoz-Darias, T., Torres, M. A. P., & Garcia, M. R. 2018, MNRAS, 479, 3987 [CrossRef] [Google Scholar]
- Negoro, H., Nakajima, M., Fujiwara, K., et al. 2024, ATel, 16804, 1 [Google Scholar]
- Neronov, A., Oikonomou, F., & Semikoz, D. 2025, Phys. Rev. D, 111, 103025 [Google Scholar]
- Nims, J., Quataert, E., & Faucher-Giguére, C.-A. 2015, MNRAS, 447, 3612 [NASA ADS] [CrossRef] [Google Scholar]
- Offringa, A. R., McKinley, B., Hurley-Walker, N., et al. 2014, MNRAS, 444, 606 [Google Scholar]
- Orosz, J. A., Kuulkers, E., van der Klis, M., et al. 2001, ApJ, 555, 489 [NASA ADS] [CrossRef] [Google Scholar]
- Paragi, Z., Vermeulen, R. C., Fejes, I., et al. 1999, A&A, 348, 910 [NASA ADS] [Google Scholar]
- Paragi, Z., Fejes, I., Vermeulen, R. C., et al. 2002, in Proceedings of the 6th EVN Symposium, eds. E. Ros, R. W. Porcas, A. P. Lobanov, & J. A. Zensus, 263 [Google Scholar]
- Ponti, G., Fender, R. P., Begelman, M. C., et al. 2012, MNRAS, 422, L11 [NASA ADS] [CrossRef] [Google Scholar]
- Rankine, A. L., Matthews, J. H., Hewett, P. C., et al. 2021, MNRAS, 502, 4154 [CrossRef] [Google Scholar]
- Remillard, R. A., & McClintock, J. E. 2006, ARA&A, 44, 49 [Google Scholar]
- Revnivtsev, M., Gilfanov, M., Churazov, E., & Sunyaev, R. 2002, A&A, 391, 1013 [NASA ADS] [CrossRef] [EDP Sciences] [Google Scholar]
- Richards, G. T., McCaffrey, T. V., Kimball, A., et al. 2021, AJ, 162, 270 [NASA ADS] [CrossRef] [Google Scholar]
- Russell, T. D., Tetarenko, A. J., Miller-Jones, J. C. A., et al. 2019, ApJ, 883, 198 [NASA ADS] [CrossRef] [Google Scholar]
- Salvesen, G., & Pokawanvit, S. 2020, MNRAS, 495, 2179 [Google Scholar]
- Savard, K., Matthews, J. H., Fender, R., & Heywood, I. 2025, MNRAS, 540, 1084 [Google Scholar]
- Sell, P. H., Heinz, S., Calvelo, D. E., et al. 2010, ApJ, 719, L194 [Google Scholar]
- Stocke, J. T., Morris, S. L., Weymann, R. J., & Foltz, C. B. 1992, ApJ, 396, 487 [Google Scholar]
- Suzuki, H., Tsuji, N., Kanemaru, Y., et al. 2025, ApJ, 978, L20 [Google Scholar]
- Tomsick, J. A., Corbel, S., Fender, R., et al. 2003, ApJ, 582, 933 [Google Scholar]
- Wan, S. Y., Wang, J. S., & Liu, R. Y. 2025, arXiv e-prints [arXiv:2507.02763] [Google Scholar]
- Woods, D. T., Klein, R. I., Castor, J. I., McKee, C. F., & Bell, J. B. 1996, ApJ, 461, 767 [NASA ADS] [CrossRef] [Google Scholar]
- Zabalza, V. 2015, Proc. Int. Cosmic Ray Conf., 2015, 922 [NASA ADS] [Google Scholar]
- Zhang, X., Yu, W., Carotenuto, F., et al. 2025, arXiv e-prints [arXiv:2504.11945] [Google Scholar]
Even though the companion is a B-type star, MacDonald et al. (2011) argue the maintenance of the LMXB classification because mass transfer occurs via Roche lobe overflow.
QSO J1820–2528 (RA = 18h20m57.8s, Dec = −25° 28′12.6″) and PMN J1819–2453 (RA = 18h19m15.1s, Dec = −24° 53′45.9″).
MeerKAT is sensitive to structures up to a maximum angular scale of ∼15′ at the L band and ∼25′ at the UHF band.
Ω is the solid angle of the outflow as seen from the central source.
Appendix A: MeerKAT observations
Summary of MeerKAT observations of V4641 Sgr.
Appendix B: H.E.S.S. and HAWC contours
In Fig. B.1, H.E.S.S. and HAWC contours are overlaid on top of the MeerKAT L-band image.
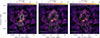 |
Fig. B.1. V4641 Sgr field as observed by the MeerKAT interferometer in the L band, along with H.E.S.S. (left) and HAWC (middle: above 1 TeV; right: above 100 TeV) gamma-ray contours at the levels of 3, 4, ..., 9 σ (H.E.S.S. Collaboration 2025; Alfaro et al. 2024). |
Appendix C: Proper motion of nearby stars
Fig. E.1 shows another representation of the Gaia data displayed in Fig. 3. Each arrow corresponds to the proper motion of an individual star.
Appendix D: Synchrotron radiation: Minimum energy requirements
Let us assume that we observe a synchrotron spectrum with some spectral index α (Sν ∝ να) between two frequencies ν1 and ν2. At a distance D the integrated luminosity is then
![Mathematical equation: $$ \begin{aligned} L = 4\pi D^2 \int _{\nu _1}^{\nu _2} S_\nu \mathrm{d} \nu = 4\pi D^2 S_{\nu _0} \nu _0^{-\alpha } \left[ \frac{\nu _2^{\alpha +1} - \nu _1^{\alpha +1}}{\alpha +1} \right] ,\end{aligned} $$](/articles/aa/full_html/2026/02/aa57124-25/aa57124-25-eq10.gif) (D.1)
(D.1)
where Sν0 is a measurement of the flux density at frequency ν0. Within the relativistic plasma the total energy is stored in the magnetic fields and in the electrons. For a source volume V, the former is given by
 (D.2)
(D.2)
where f is a filling factor accounting for the fraction of V which is actually occupied by the relativistic plasma. The energy in electrons, for a power-law distribution of index p = 2(1 − α), is given by
 (D.3)
(D.3)
where
 (D.4)
(D.4)
and
![Mathematical equation: $$ \begin{aligned} {c}(p, \nu _1, \nu _2) = \frac{p-3}{p-2} \left[ \frac{\nu _1^{(2-p)/2} - \nu _2^{(2-p)/2}}{\nu _1^{(3-p)/2} - \nu _2^{(3-p)/2}} \right]. \end{aligned} $$](/articles/aa/full_html/2026/02/aa57124-25/aa57124-25-eq14.gif) (D.5)
(D.5)
Since EB ∝ B2 and Ee ∝ B−3/2, there exists a value of B for which the total energy is minimum. This occurs close to equipartition between energies in electrons and magnetic fields,
 (D.6)
(D.6)
where η = 1 + β, and β is the ratio of energy in protons to that in electrons. For synchrotron sources, η = 1 (i.e., ignoring the protons) is generally assumed. This leads to the equipartition magnetic field
 (D.7)
(D.7)
along with the associated total minimum energy,
 (D.8)
(D.8)
Appendix E: Spectral emissivity of thermal bremsstrahlung radiation
Consider a plasma of electrons and protons with particle densities ne and n at temperature T. The free-free spectral emissivity is given by
 (E.1)
(E.1)
where
 (E.2)
(E.2)
Here, g(ν, T) is the Gaunt factor and at radio frequencies takes the form of
![Mathematical equation: $$ \begin{aligned} g(\nu , T) = \frac{\sqrt{3}}{2\pi } \left[ \ln \left(\frac{128\varepsilon _0^2 k_B^3 T^3}{m_e e^4 \nu ^2 Z^2}\right) - \gamma ^{1/2} \right] \end{aligned} $$](/articles/aa/full_html/2026/02/aa57124-25/aa57124-25-eq20.gif) (E.3)
(E.3)
where γ ≃ 0.577 is Euler’s constant. Assuming a fully ionized hydrogen plasma (ne = n, Z = 1), we can infer the electron density from εν and T as
![Mathematical equation: $$ \begin{aligned} n_e = \left[ \frac{\varepsilon _\nu T^{1/2} \exp (h\nu /k_B T)}{\kappa g(\nu , T)} \right]^{1/2}. \end{aligned} $$](/articles/aa/full_html/2026/02/aa57124-25/aa57124-25-eq21.gif) (E.4)
(E.4)
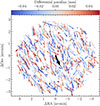 |
Fig. E.1. Motion of nearby stars in the plane of the sky, as measured by Gaia. Each arrow represent the proper motion (direction and modulus) of a star at a certain position. Only stars within a 3′ radius and a p★ ± 2σp★ parallax range are shown. The differential parallax between V4641 Sgr and individual stars is color-coded. The black arrow corresponds to the direction of the average proper motion. |
All Tables
All Figures
|
Fig. 1. V4641 Sgr field as observed by the MeerKAT interferometer in the L band (central frequency of 1.217 GHz), with an angular resolution of 8″. The background noise level is 4 μJy beam−1, while the noise level in the region surrounding the bow-tie is on the order of 10 μJy beam−1. The position of V4641 Sgr is marked by a black dot inside a white circle. The inset shows the central region of the field, with the bow-tie outlined in white. The white arrow indicates the proper motion of V4641 Sgr with respect to nearby stars, in the north-northeastern (NNE) direction (position angle of 15° E of N; see Sect. 3.2). |
| In the text | |
|
Fig. 2. V4641 Sgr field as observed by the MeerKAT interferometer in the L band, along with H.E.S.S. gamma-ray contours (energy range of 0.8 to 22 TeV) at the levels of 3, 4, ..., 9σ (H.E.S.S. Collaboration 2025). The dashed circle and the shaded area represent the radius of the XRISM X-ray source and its uncertainty (Suzuki et al. 2025). |
| In the text | |
|
Fig. 3. Proper motion of stars in the vicinity of V4641 Sgr, in the direction of increasing right ascension (x-axis) and declination (y-axis), as measured by Gaia. Only stars within a 3′ radius and a p★ ± 2σp★ parallax range are shown. The differential parallax between V4641 Sgr and individual stars is color-coded. The black star ★ corresponds to the optical counterpart of V4641 Sgr, while the dotted gray lines indicate the average proper motion in the sample. |
| In the text | |
|
Fig. 4. Broadband spectral energy distribution. Emission from the central 10′ around V4641 Sgr is shown (coincident MeerKAT and XRISM detections), together with Fermi-LAT, H.E.S.S., HAWC and LHAASO spectra (Suzuki et al. 2025; Neronov et al. 2025; H.E.S.S. Collaboration 2025; Alfaro et al. 2024; LHAASO Collaboration 2025) at larger scales (∼1°). The gray points correspond to gamma-ray fluxes, scaled down to the XRISM source region by relative area. Synchrotron and IC models (dotted lines), as well as the pion decay model (black solid line) are overlaid. |
| In the text | |
|
Fig. 5. Schematic illustration of the bow-tie around V4641 Sgr in the plane of the sky. In our model, the geometry of the bow-tie is a cone of radius, R, and height, H, with V4641 Sgr at its vertex. The symmetry axis of the cone has a position angle of −50° E of N. φ is the projected opening angle of the structure. The black dot corresponds to the position of V4641 Sgr, while the direction of the 1999 radio jets (−18° E of N; Hjellming et al. 2000) is represented in dark blue. The pink shaded areas symbolize the gamma-ray bubbles (Alfaro et al. 2024; LHAASO Collaboration 2025; H.E.S.S. Collaboration 2025). |
| In the text | |
|
Fig. B.1. V4641 Sgr field as observed by the MeerKAT interferometer in the L band, along with H.E.S.S. (left) and HAWC (middle: above 1 TeV; right: above 100 TeV) gamma-ray contours at the levels of 3, 4, ..., 9 σ (H.E.S.S. Collaboration 2025; Alfaro et al. 2024). |
| In the text | |
|
Fig. E.1. Motion of nearby stars in the plane of the sky, as measured by Gaia. Each arrow represent the proper motion (direction and modulus) of a star at a certain position. Only stars within a 3′ radius and a p★ ± 2σp★ parallax range are shown. The differential parallax between V4641 Sgr and individual stars is color-coded. The black arrow corresponds to the direction of the average proper motion. |
| In the text | |
Current usage metrics show cumulative count of Article Views (full-text article views including HTML views, PDF and ePub downloads, according to the available data) and Abstracts Views on Vision4Press platform.
Data correspond to usage on the plateform after 2015. The current usage metrics is available 48-96 hours after online publication and is updated daily on week days.
Initial download of the metrics may take a while.