Fig. 1
Download original image
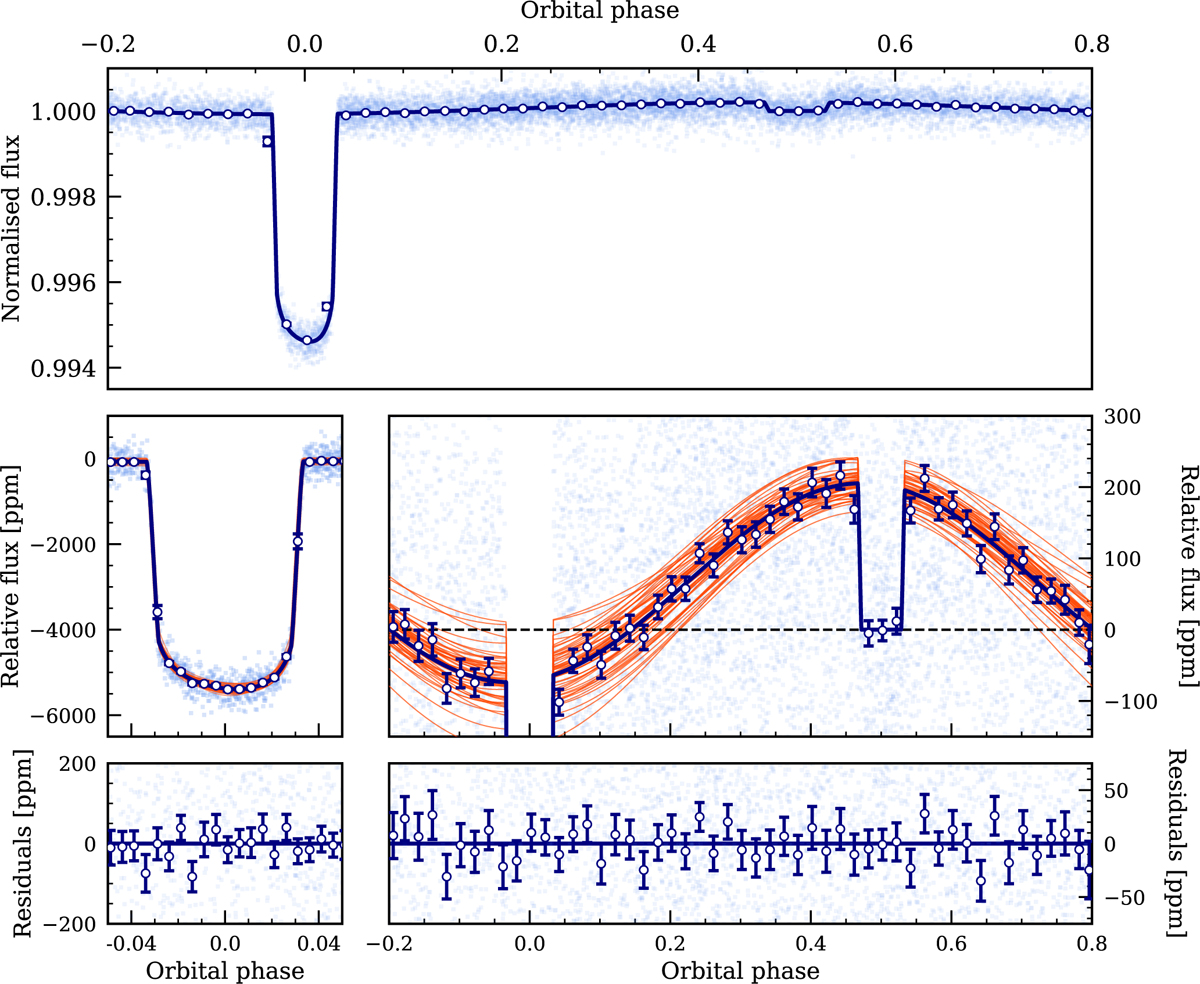
Detrended and phase-folded TESS data along with the best-fit model. The light and dark blue points show the unbinned and binned data points. The dark blue and orange lines are the median model and models computed from randomly selected posteriors, respectively. Top: full phase curve with a transit and occultation. Middle: zoom-in on the transit (middle left) and occultation/phase curve (middle right). The dashed line represents the level of stellar flux (i.e. flux level during the occultation). The gravity darkened asymmetric transit and a phase variation, along with an occultation, are clearly visible in the middle panel. Bottom: residuals after subtracting the median model from the raw data.
Current usage metrics show cumulative count of Article Views (full-text article views including HTML views, PDF and ePub downloads, according to the available data) and Abstracts Views on Vision4Press platform.
Data correspond to usage on the plateform after 2015. The current usage metrics is available 48-96 hours after online publication and is updated daily on week days.
Initial download of the metrics may take a while.