Fig. 3
Download original image
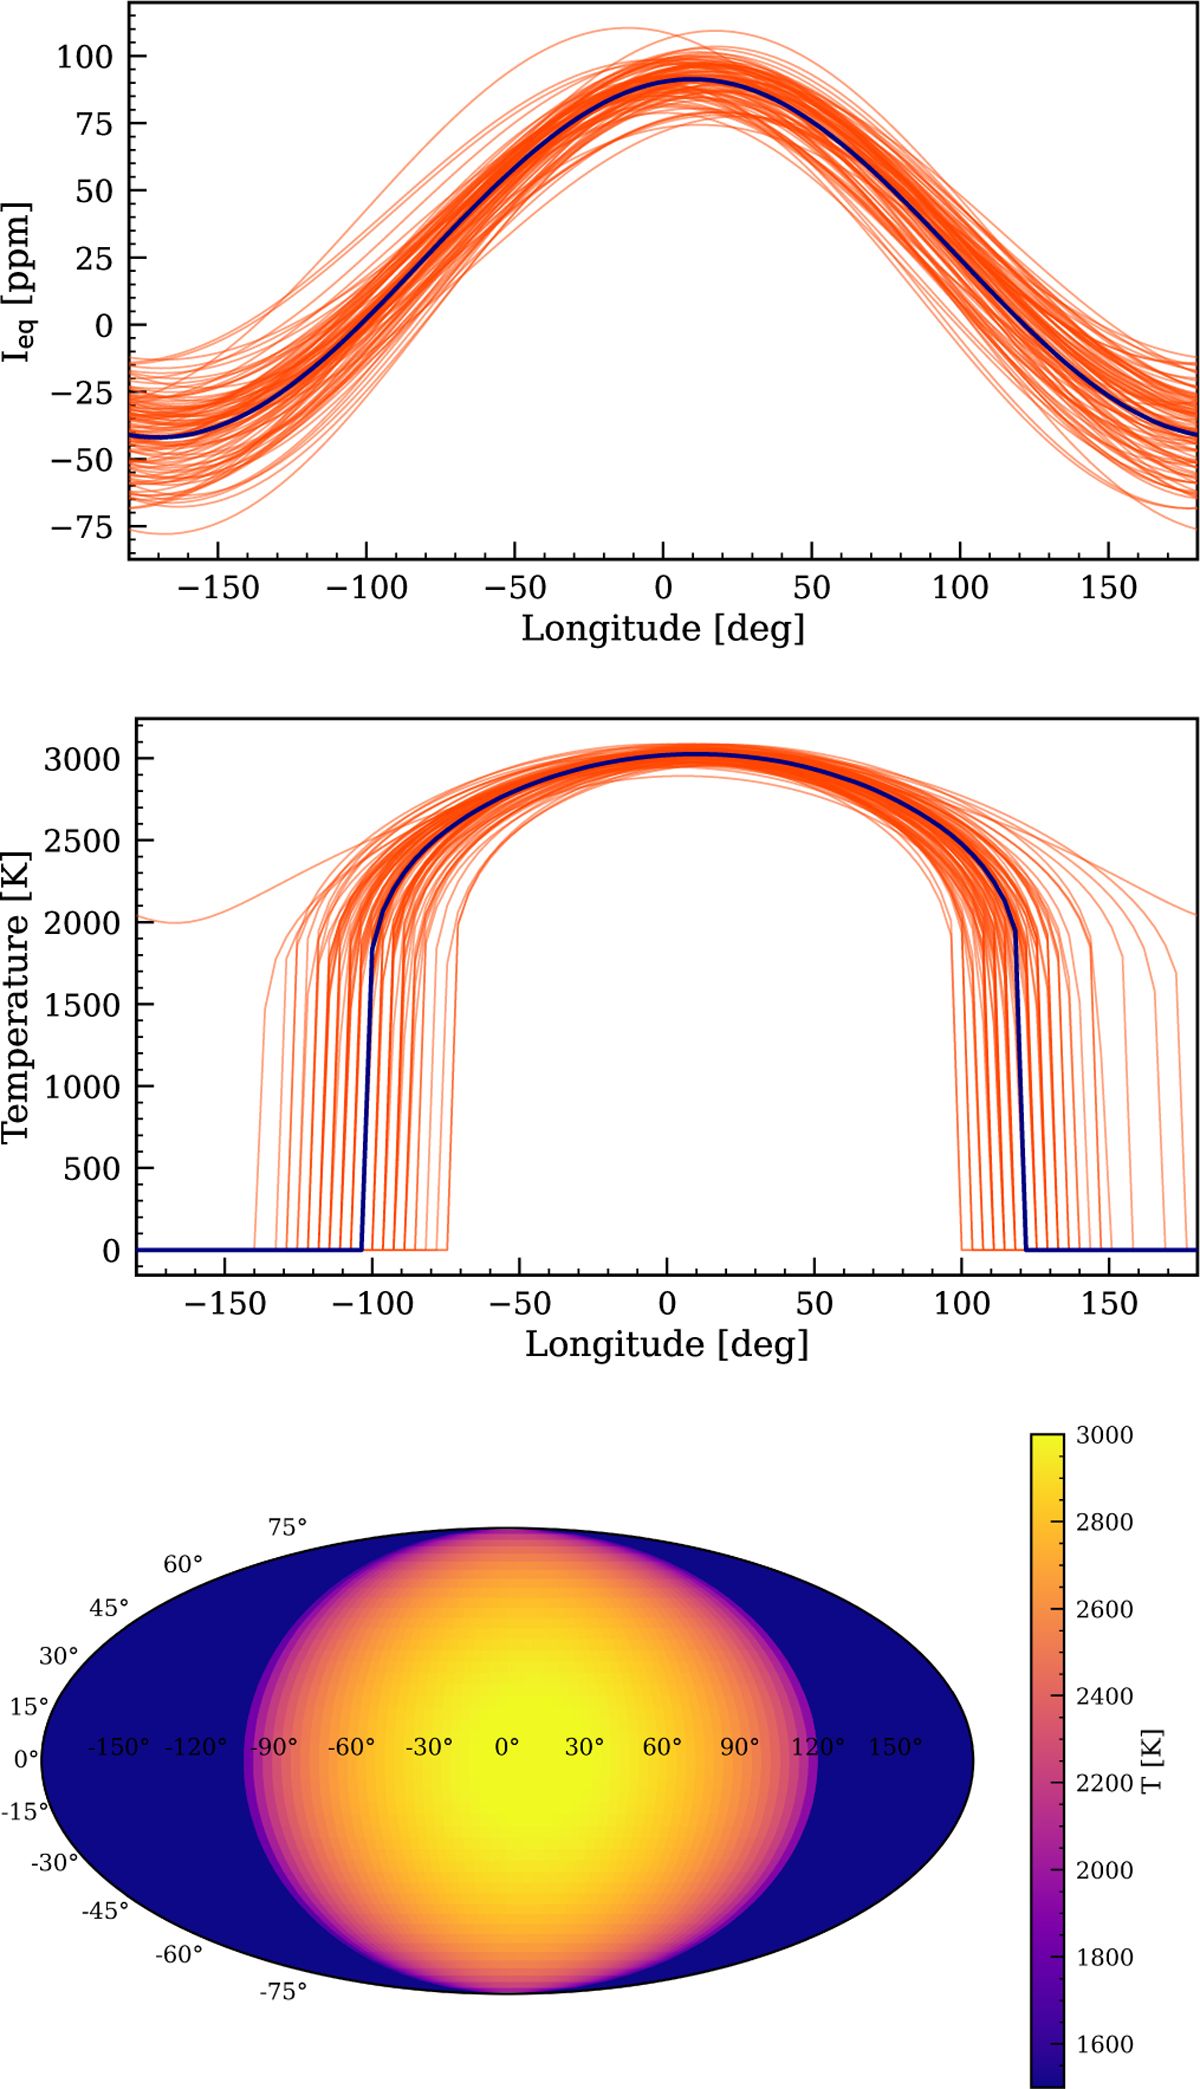
Brightness and temperature maps of the planet. Top: equatorial brightness in the units of stellar brightness as a function of longitude. Middle: 1D temperature distribution on planetary equator as a function of planetary longitude. Bottom: median 2D latitude-longitude temperature map of the planet. The dark blue and orange lines in the top and middle plots show the median and randomly selected models from the posterior distribution.
Current usage metrics show cumulative count of Article Views (full-text article views including HTML views, PDF and ePub downloads, according to the available data) and Abstracts Views on Vision4Press platform.
Data correspond to usage on the plateform after 2015. The current usage metrics is available 48-96 hours after online publication and is updated daily on week days.
Initial download of the metrics may take a while.