Fig. 5
Download original image
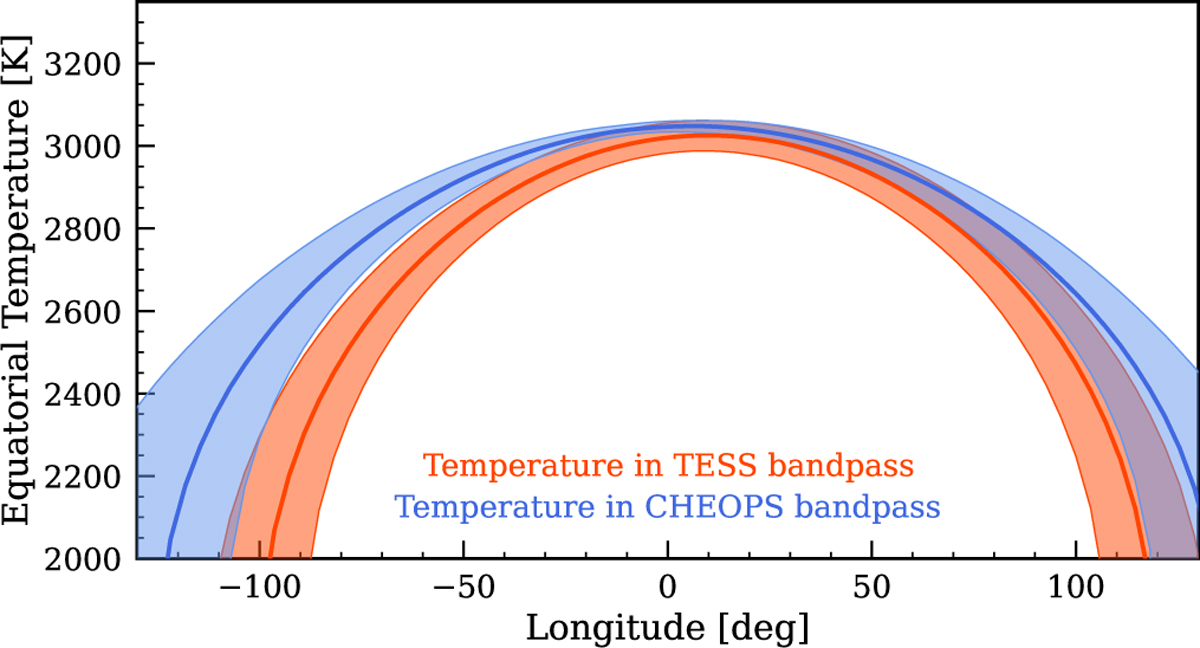
Equatorial temperatures as a function of longitude as observed by TESS (orange) and CHEOPS (blue) bandpasses. The solid lines give median values of temperatures, while the shaded regions show the bands of 1σ uncertainty in temperatures. Some nightside longitudes are not shown since our modelling is not able to properly constrain temperatures on very high longitudes.
Current usage metrics show cumulative count of Article Views (full-text article views including HTML views, PDF and ePub downloads, according to the available data) and Abstracts Views on Vision4Press platform.
Data correspond to usage on the plateform after 2015. The current usage metrics is available 48-96 hours after online publication and is updated daily on week days.
Initial download of the metrics may take a while.