Open Access
Fig. 6
Download original image
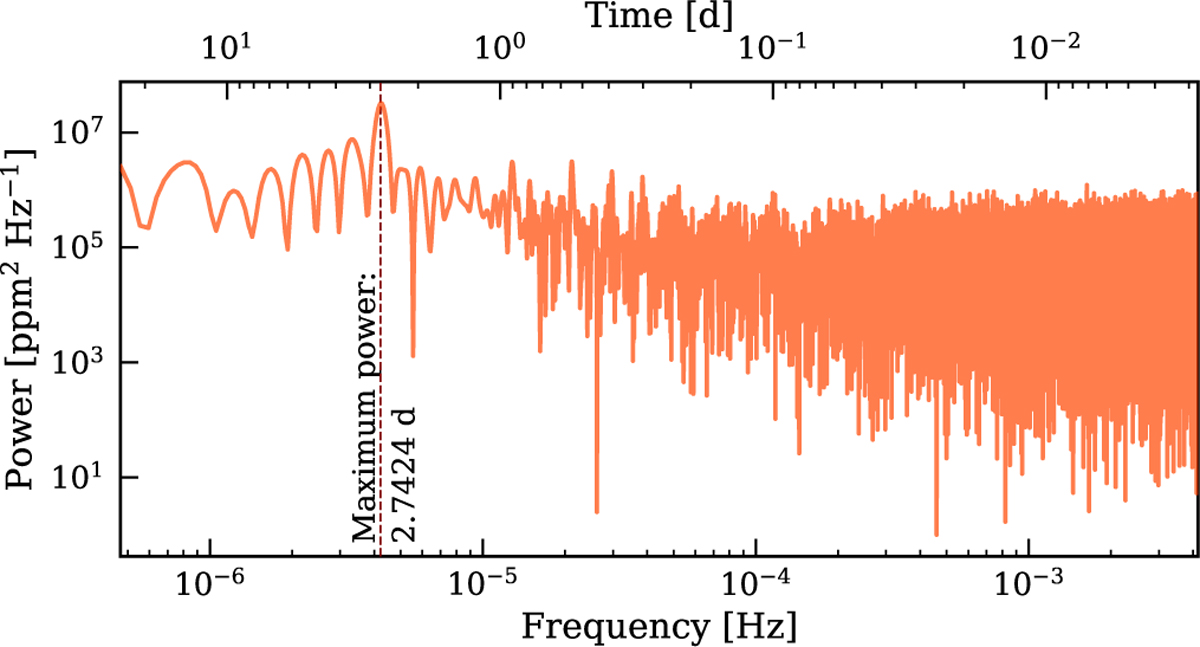
Lomb–Scargle periodogram of the TESS light curve after subtracting the instrumental noise. The bottom and upper axes of the figure show the frequency and time domain, respectively. The period range covered by the periodogram is from the period corresponding to the Nyquist frequency to the total duration of the observation.
Current usage metrics show cumulative count of Article Views (full-text article views including HTML views, PDF and ePub downloads, according to the available data) and Abstracts Views on Vision4Press platform.
Data correspond to usage on the plateform after 2015. The current usage metrics is available 48-96 hours after online publication and is updated daily on week days.
Initial download of the metrics may take a while.