Open Access
Fig. 1.
Download original image
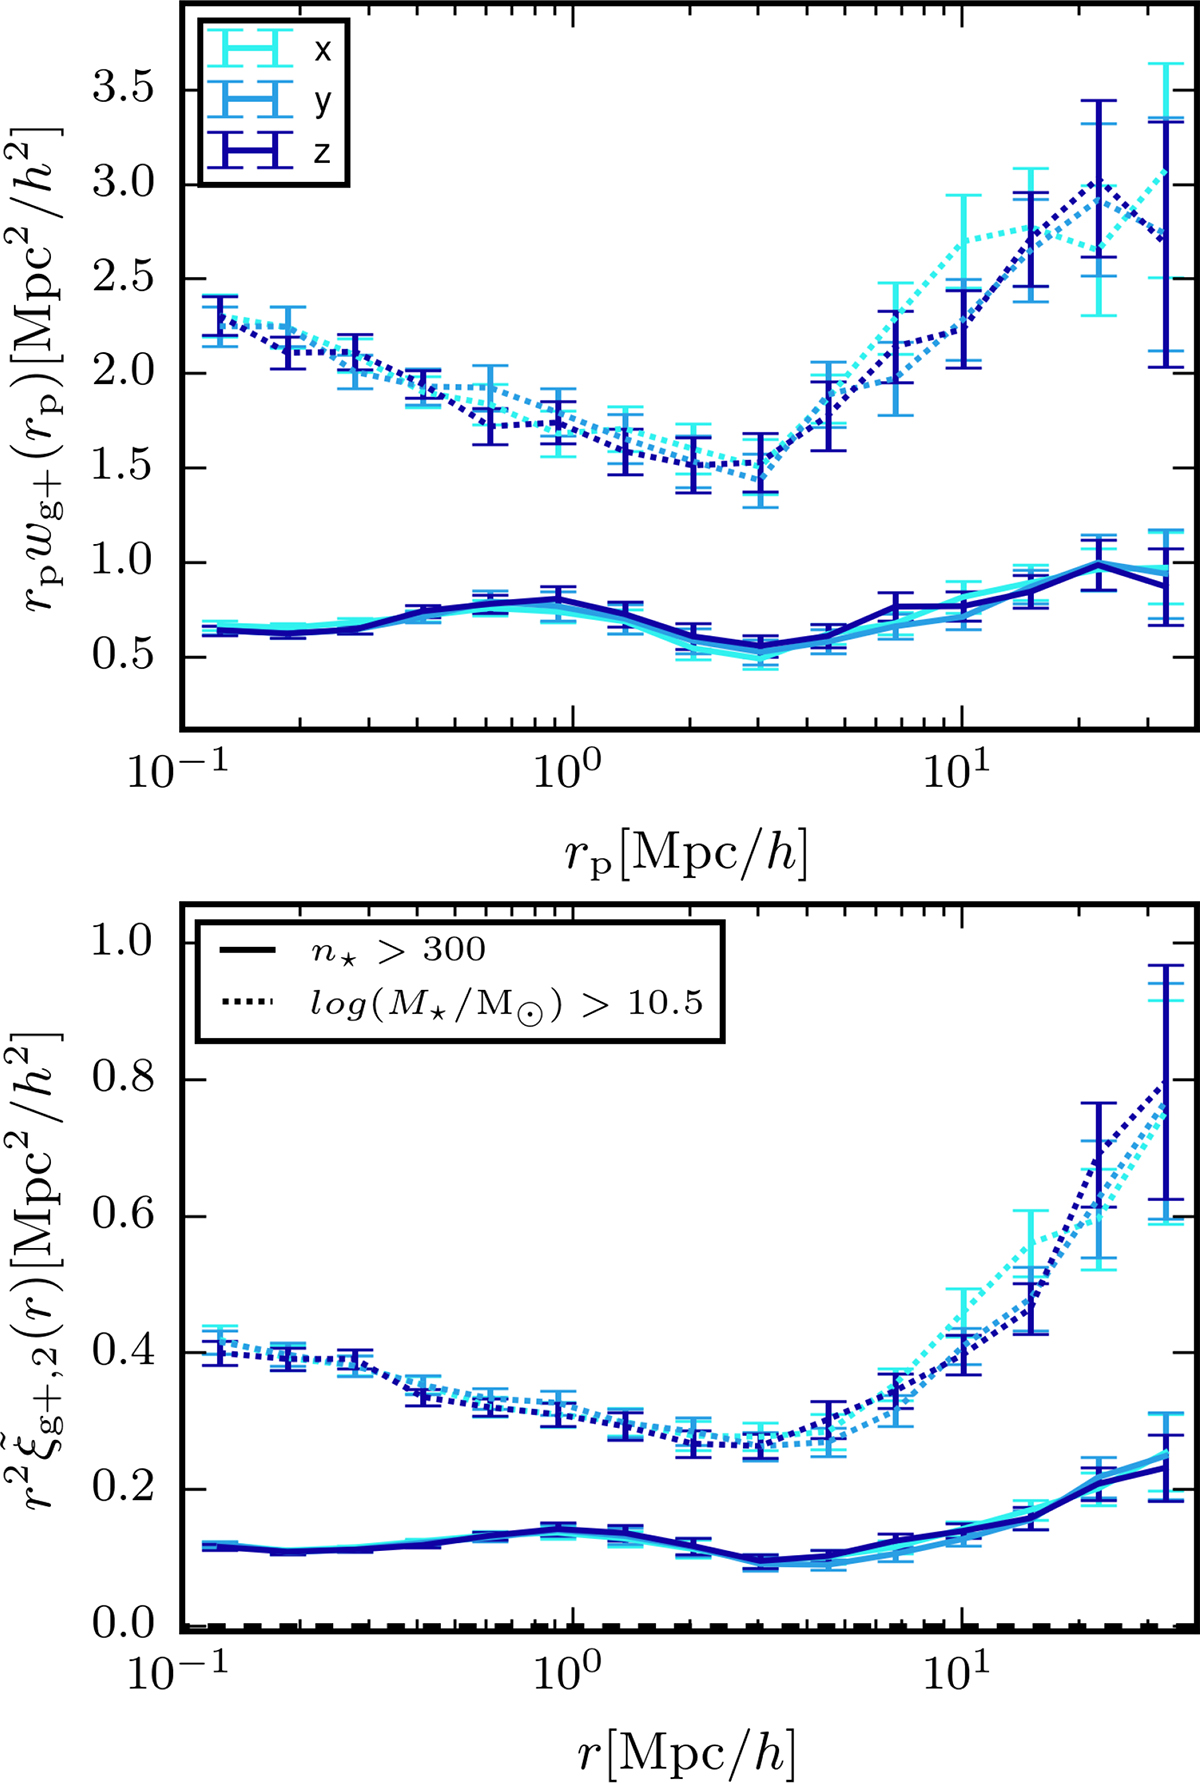
Correlation functions, rpwg+ (top) and ![]() (bottom), in TNG300 for two shape samples: n★ > 300 (continuous lines) and log(M★ h/M⊙) > 10.5 (dashed lines). The shapes are projected over the x (light blue), y (medium blue), and z (dark blue) axes and measured using the simple inertia tensor.
(bottom), in TNG300 for two shape samples: n★ > 300 (continuous lines) and log(M★ h/M⊙) > 10.5 (dashed lines). The shapes are projected over the x (light blue), y (medium blue), and z (dark blue) axes and measured using the simple inertia tensor.
Current usage metrics show cumulative count of Article Views (full-text article views including HTML views, PDF and ePub downloads, according to the available data) and Abstracts Views on Vision4Press platform.
Data correspond to usage on the plateform after 2015. The current usage metrics is available 48-96 hours after online publication and is updated daily on week days.
Initial download of the metrics may take a while.