Open Access
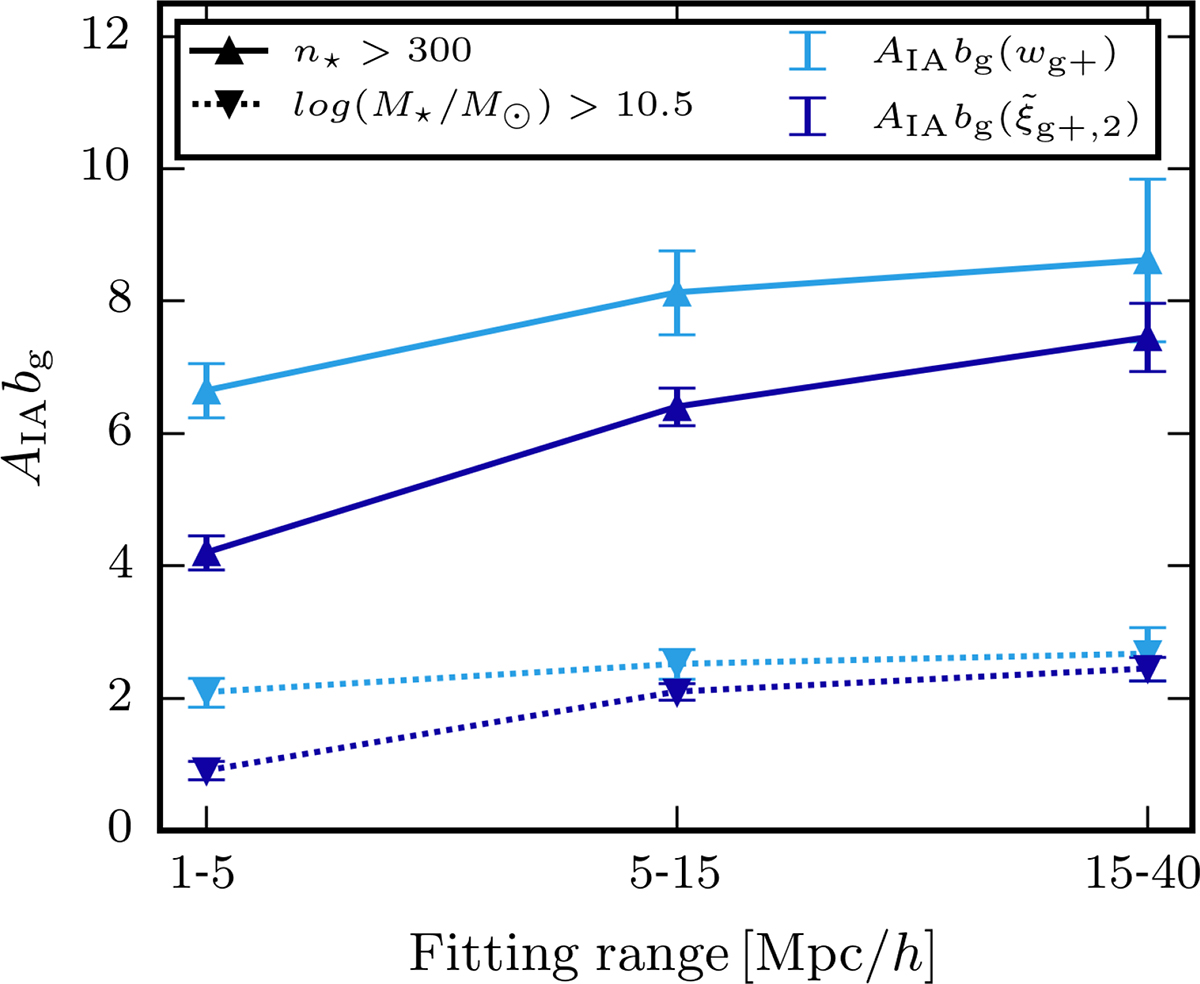
Fig. F.2.
Download original image
Evolution of NLA AIAbg when fitting within different scale ranges, shown for particle number and mass cut with upward triangles and solid lines, and downward triangles and dashed lines, respectively. NLA amplitudes fitted with ![]() are depicted in dark blue and those fitted with wg+ in light blue, including the error bars.
are depicted in dark blue and those fitted with wg+ in light blue, including the error bars.
Current usage metrics show cumulative count of Article Views (full-text article views including HTML views, PDF and ePub downloads, according to the available data) and Abstracts Views on Vision4Press platform.
Data correspond to usage on the plateform after 2015. The current usage metrics is available 48-96 hours after online publication and is updated daily on week days.
Initial download of the metrics may take a while.