Fig. 4.
Download original image
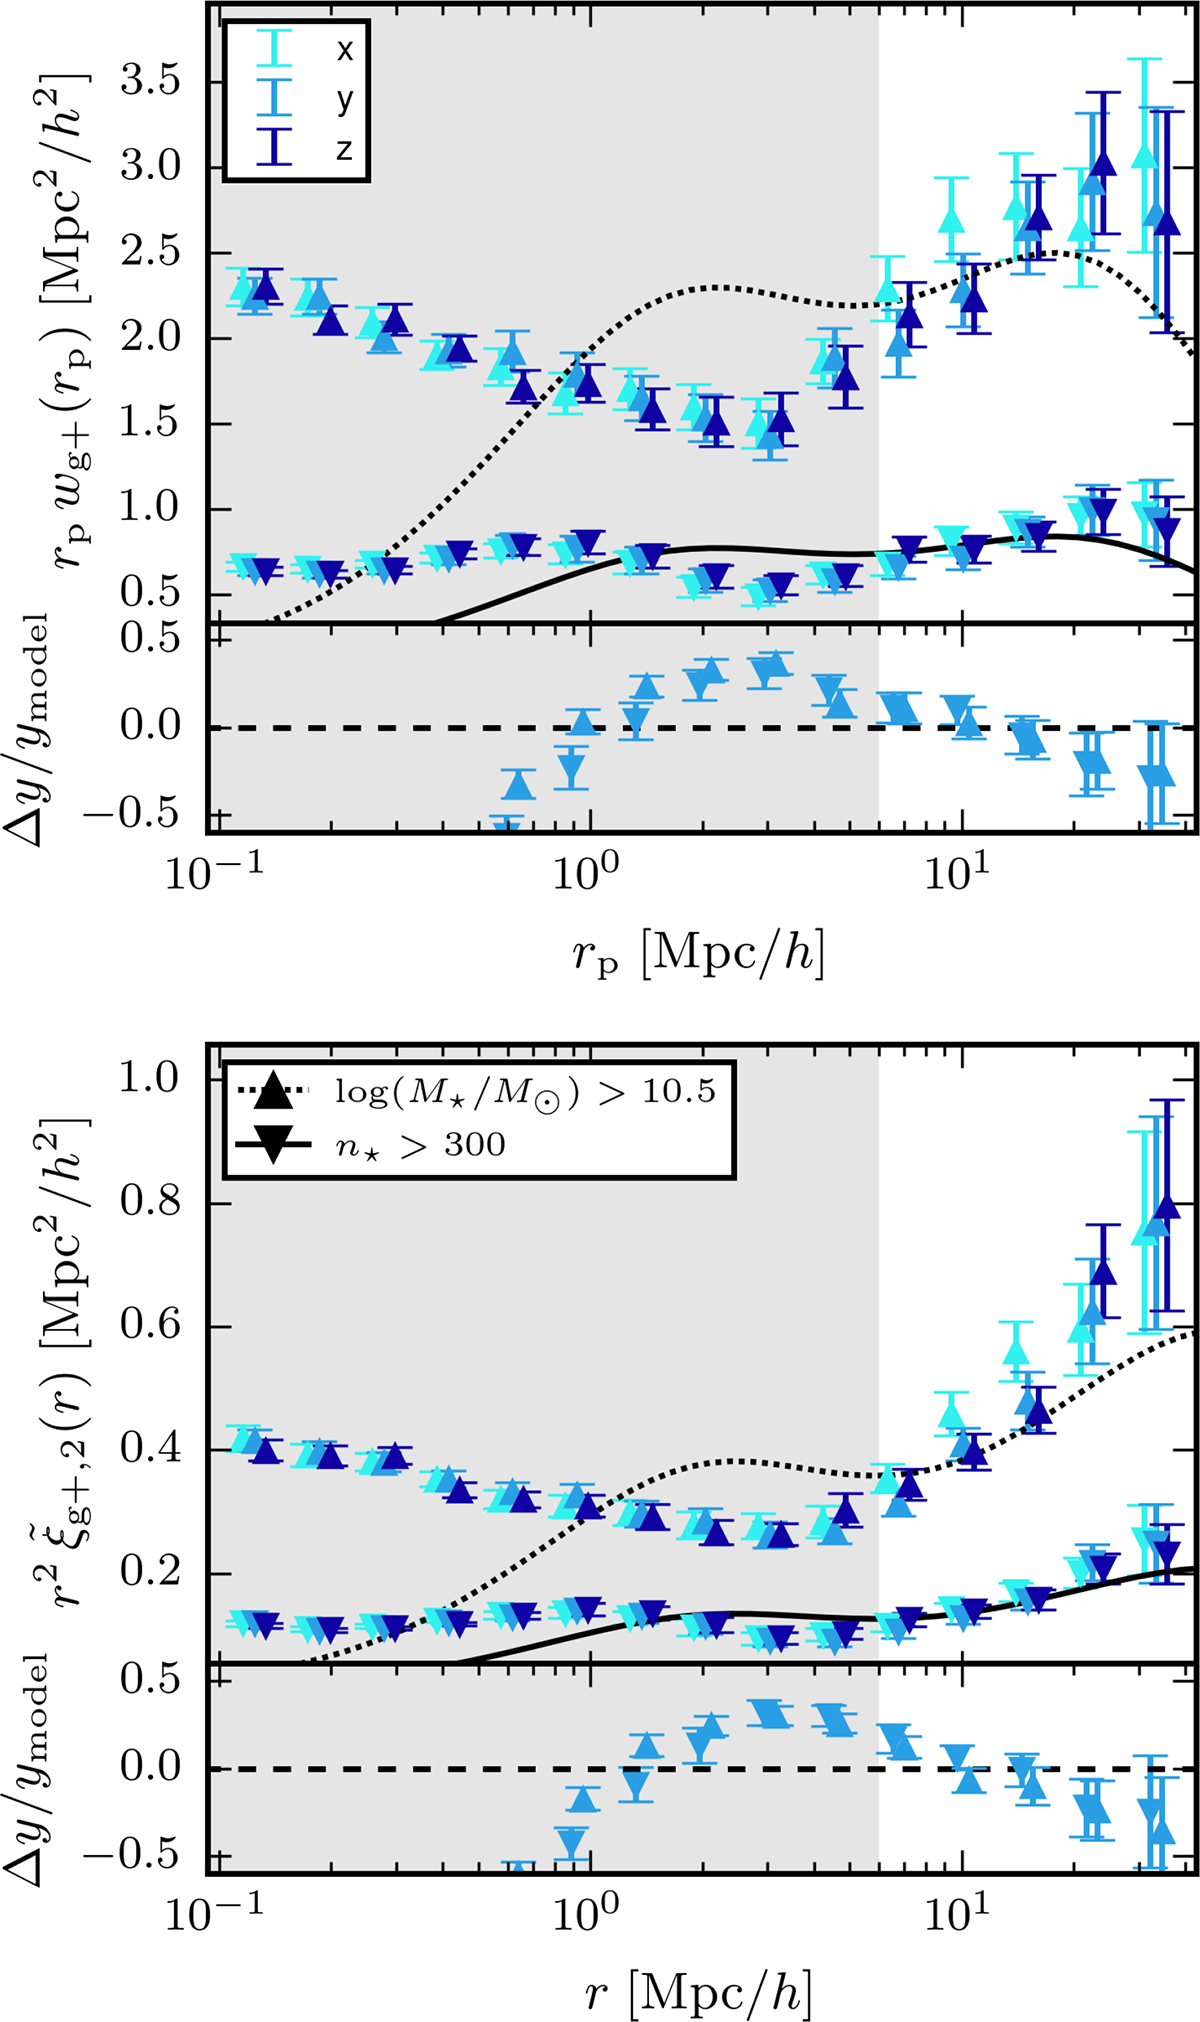
Correlation functions, rpwg+ (top) and ![]() (bottom) in TNG300 for two shape samples: n★ > 300 (downward triangle) and log(M★ h/M⊙) > 10.5 (upward triangle). The shapes are projected over the x (light blue), y (medium blue) and z (dark blue) axes and measured using the simple inertia tensor, whereas the joint NLA fit is shown as a solid (dashed) line for the cut in n★ (M★). The second panel in both plots shows the fit residual for the y-projection. Grey regions indicate excluded regions for the fit. Note: the data points are slightly horizontally displaced for easier readability.
(bottom) in TNG300 for two shape samples: n★ > 300 (downward triangle) and log(M★ h/M⊙) > 10.5 (upward triangle). The shapes are projected over the x (light blue), y (medium blue) and z (dark blue) axes and measured using the simple inertia tensor, whereas the joint NLA fit is shown as a solid (dashed) line for the cut in n★ (M★). The second panel in both plots shows the fit residual for the y-projection. Grey regions indicate excluded regions for the fit. Note: the data points are slightly horizontally displaced for easier readability.
Current usage metrics show cumulative count of Article Views (full-text article views including HTML views, PDF and ePub downloads, according to the available data) and Abstracts Views on Vision4Press platform.
Data correspond to usage on the plateform after 2015. The current usage metrics is available 48-96 hours after online publication and is updated daily on week days.
Initial download of the metrics may take a while.