Fig. B.1.
Download original image
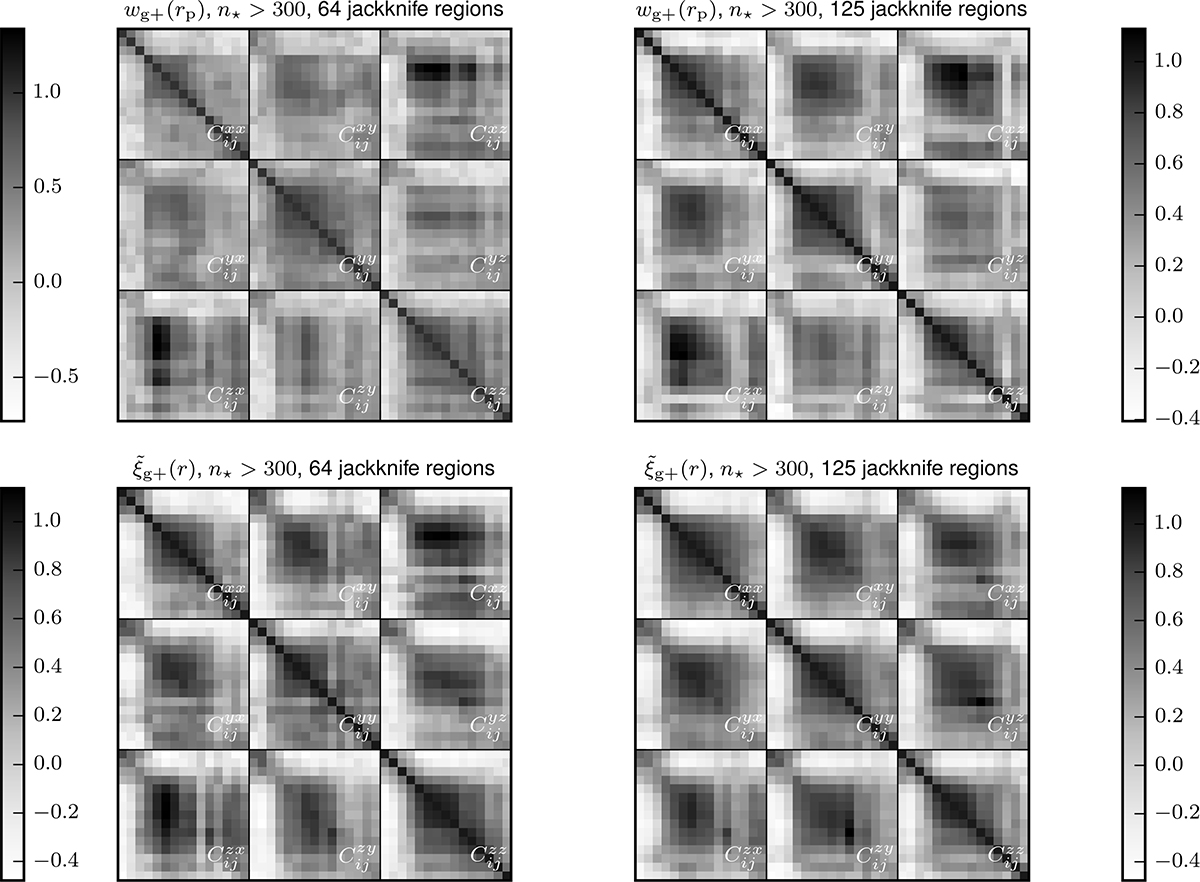
Normalised combined covariance matrices for wg+ (top) and ![]() (bottom) for the n★ > 300 shape sample, using 64 jackknife samples (left) or 125 jackknife regions (right). Darker colours indicate higher values. Each block of the combined covariance matrix is labelled according to the definitions in Sect. 3.4. The right side of the figure is equal to Fig. 2.
(bottom) for the n★ > 300 shape sample, using 64 jackknife samples (left) or 125 jackknife regions (right). Darker colours indicate higher values. Each block of the combined covariance matrix is labelled according to the definitions in Sect. 3.4. The right side of the figure is equal to Fig. 2.
Current usage metrics show cumulative count of Article Views (full-text article views including HTML views, PDF and ePub downloads, according to the available data) and Abstracts Views on Vision4Press platform.
Data correspond to usage on the plateform after 2015. The current usage metrics is available 48-96 hours after online publication and is updated daily on week days.
Initial download of the metrics may take a while.