Fig. 11
Download original image
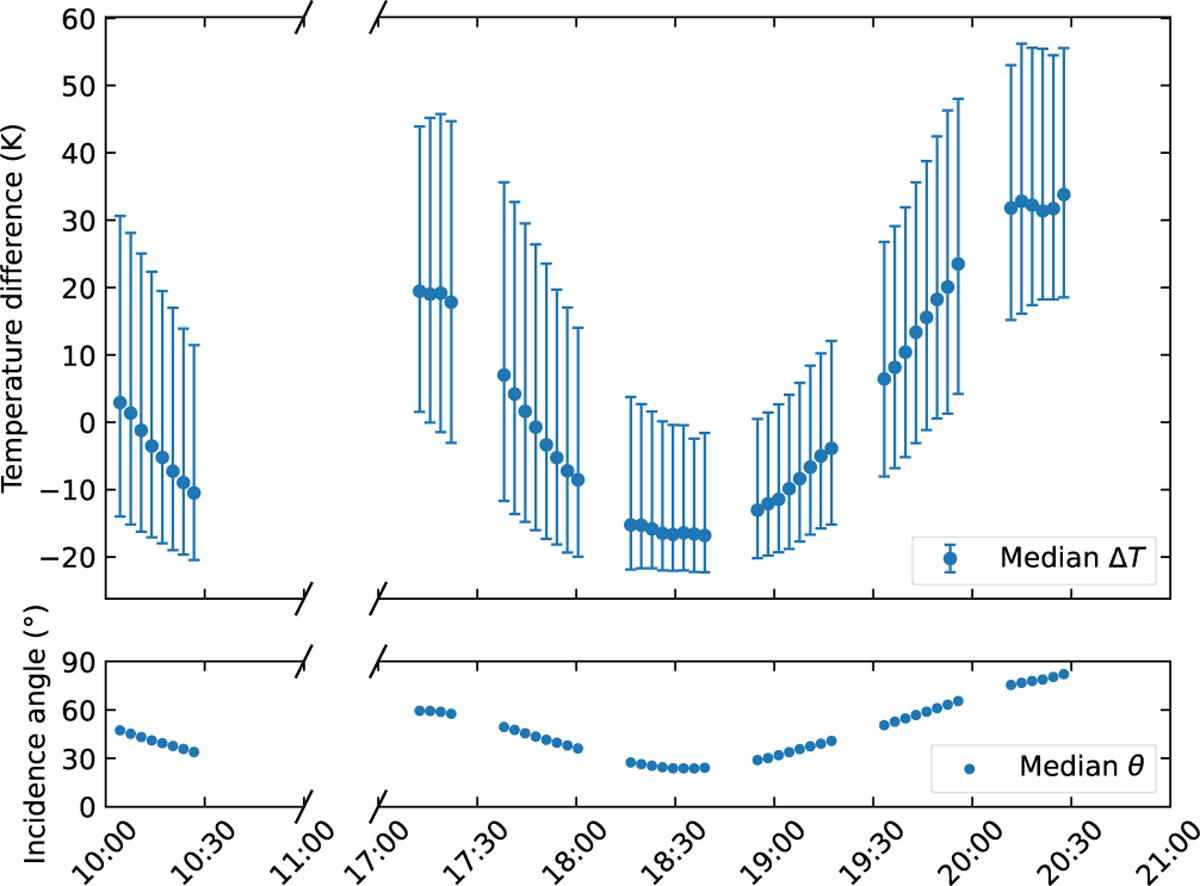
Median temperature differences between the TIR temperatures and the simulated temperatures of all facets in the Kolobok crater for the global temperature mapping done for 1 August 2018 (all times UTC; Okada et al. 2020). The error bars indicate the range of the 10th and 90th percentiles of temperature differences on the 907 facets used for the simulation. The bottom panel shows the median incidence angle of all facets visible to TIR at the given time. A gap in the data between 10:30 and 14:00 exists and only points are used where more than 453 facets of the employed shape model were seen by TIR, which widens the data gap up to 17:00.
Current usage metrics show cumulative count of Article Views (full-text article views including HTML views, PDF and ePub downloads, according to the available data) and Abstracts Views on Vision4Press platform.
Data correspond to usage on the plateform after 2015. The current usage metrics is available 48-96 hours after online publication and is updated daily on week days.
Initial download of the metrics may take a while.