Fig. 4
Download original image
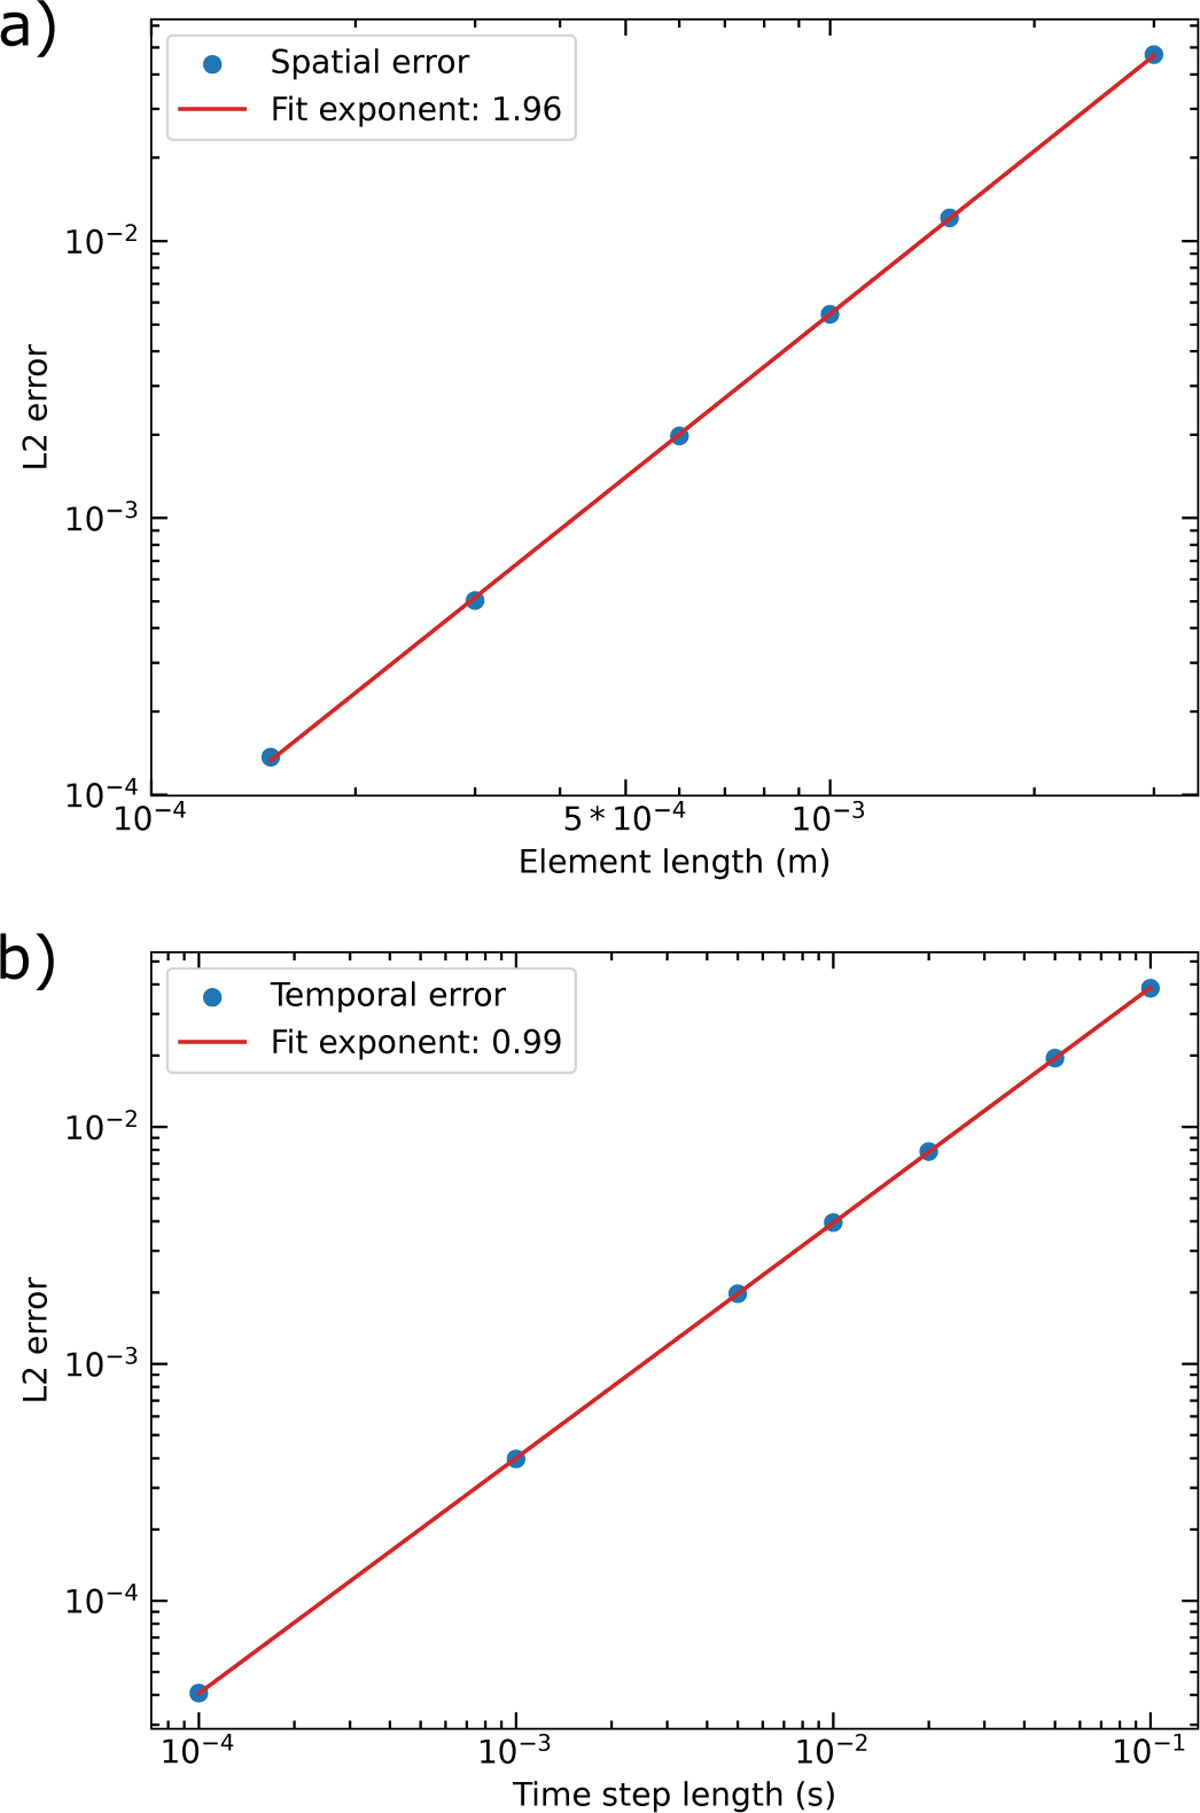
Convergence analysis of MoCSI code for the comparison against the analytical solution given by Eq. (18). Panel a: spatial convergence shown by plotting L2 error against element length. Panel b: temporal convergence shown by plotting L2 error against time-step length. Power-law fits for both plots have been produced, verifying that both the temporal and spatial convergence show the expected slopes of 1 and 2, respectively.
Current usage metrics show cumulative count of Article Views (full-text article views including HTML views, PDF and ePub downloads, according to the available data) and Abstracts Views on Vision4Press platform.
Data correspond to usage on the plateform after 2015. The current usage metrics is available 48-96 hours after online publication and is updated daily on week days.
Initial download of the metrics may take a while.