Fig. 5
Download original image
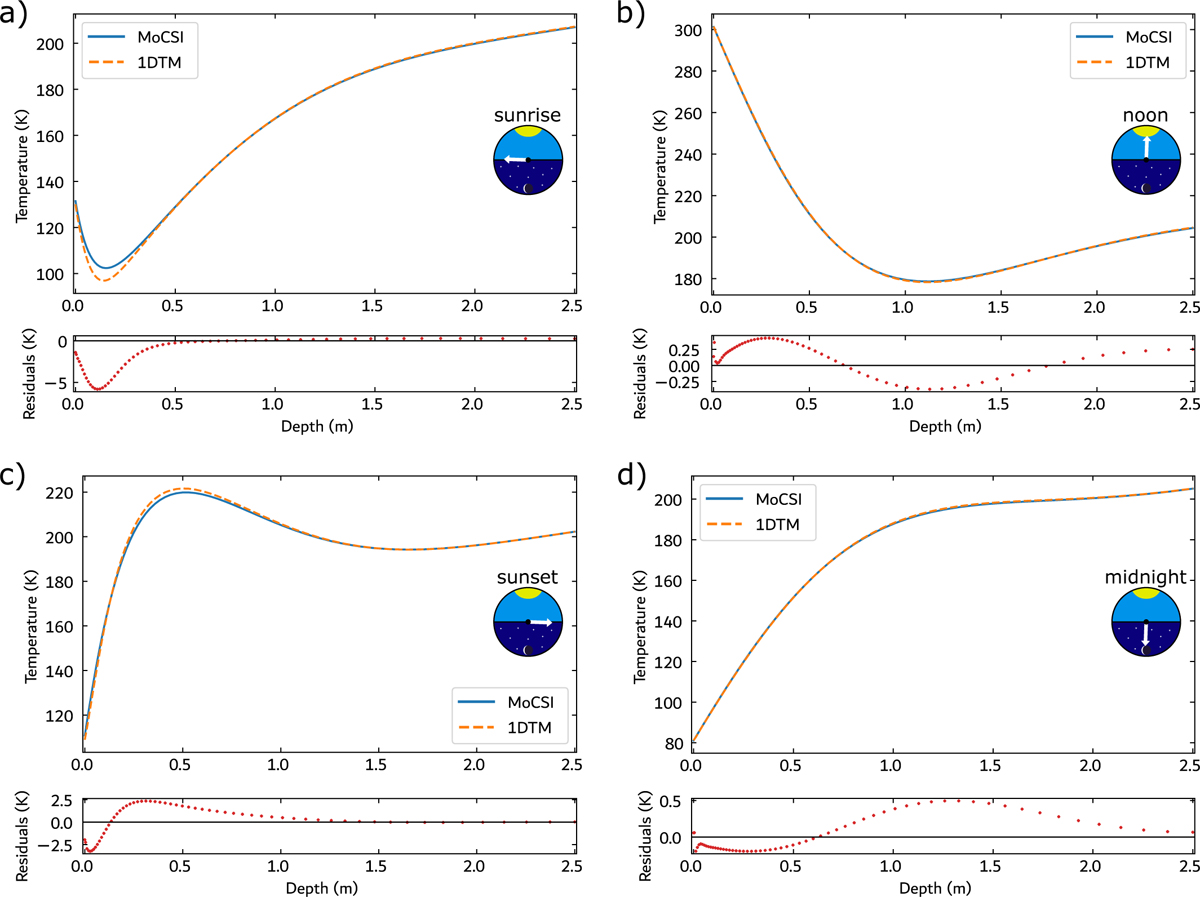
Selected temperature profiles showing comparison between MoCSI code and 1DTM code at different times; i.e., the first time step after sunrise (panel a), the time step closest to noon (panel b), the first time step after sunset (panel c), and the time step closest to midnight (panel d). The differences during sunrise and sunset can be explained by the difference in surface-temperature prediction scheme, as also discussed in Schörghofer & Khatiwala (2024). Away from the boundary, where gradients are less steep, the two implementations show good agreement. Since surface temperatures differ slightly between the models, these differences propagate downward with the thermal profile. This explains the wavy structure in the residuals.
Current usage metrics show cumulative count of Article Views (full-text article views including HTML views, PDF and ePub downloads, according to the available data) and Abstracts Views on Vision4Press platform.
Data correspond to usage on the plateform after 2015. The current usage metrics is available 48-96 hours after online publication and is updated daily on week days.
Initial download of the metrics may take a while.