Fig. 7
Download original image
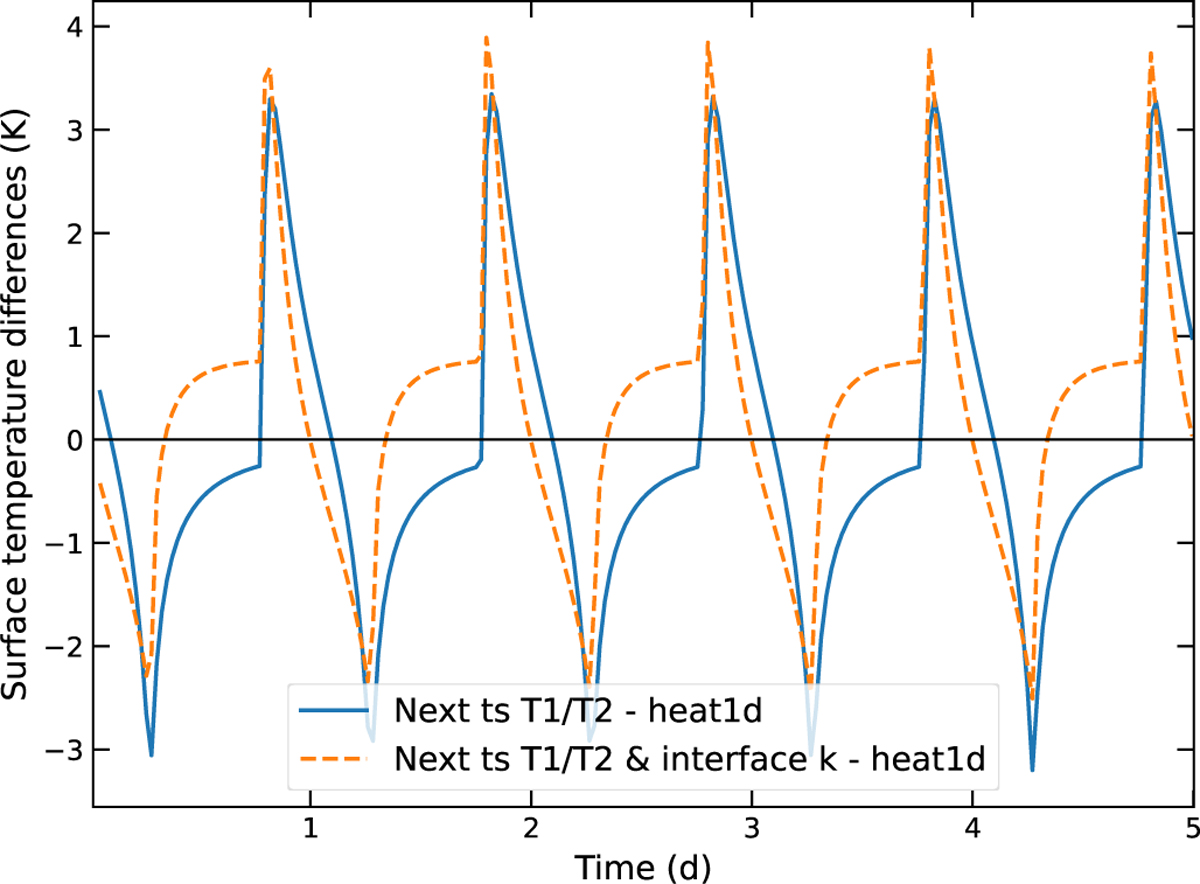
Temperature differences between standard heat1d implementation of surface-temperature calculation and two other implementations. The implementation represented by the blue line uses the temperatures of the next time step to approximate the temperature differential in the boundary condition. The implementation represented by the dashed orange line also uses the temperatures of the next time step and also calculates the heat conductivity at the interface between two grid points instead of directly at the points. While this is only a rough approximation of the changes a fully iterative heat1d would produce, it shows the general difference in temperatures we can expect from the changes to be in the low-Kelvin range.
Current usage metrics show cumulative count of Article Views (full-text article views including HTML views, PDF and ePub downloads, according to the available data) and Abstracts Views on Vision4Press platform.
Data correspond to usage on the plateform after 2015. The current usage metrics is available 48-96 hours after online publication and is updated daily on week days.
Initial download of the metrics may take a while.