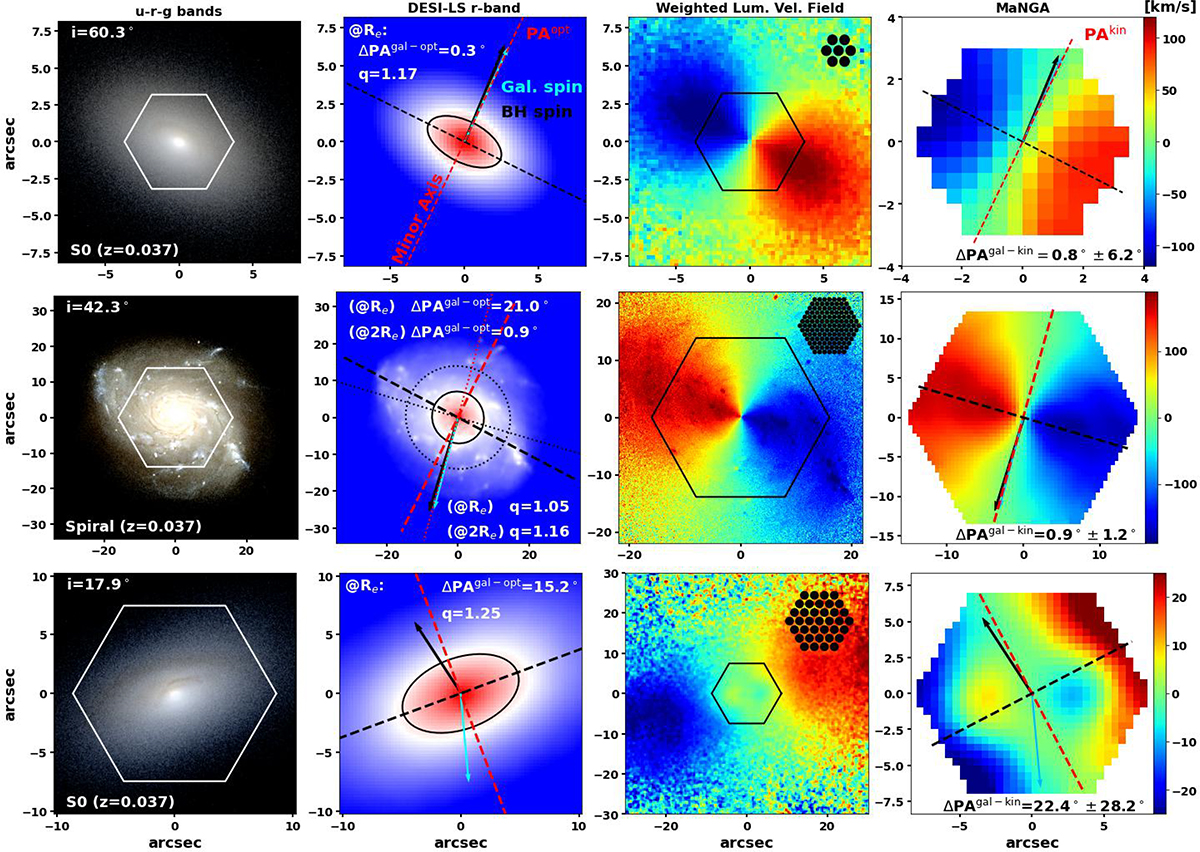
Fig. 3.
Download original image
Examples of synthetic optical and kinematic images derived in our analysis. Each row corresponds to a specific galaxy. The first column shows high resolution images using u-g-r bands, along with the value of the inclination angle (i) at which the galactic plan is viewed by the observer (see Fig. 19 in Peirani et al. 2024). The second column presents synthetic DESI-LS-like r-band images with a resolution of 0.262 arcsec per pixel, convolved with a PSF having a FWHM of 1.2 arcsec. The dashed black and red lines indicate the orientations of the major and minor photometric axes, respectively. The semimajor axis of each ellipse corresponds to the effective radius (Re), while the orientation of the semiminor axis serves as a proxy for the direction of the projected stellar angular momentum. For comparison, these panels also include the projected BH spin vector (in black) and the projected stellar angular momentum vector (in cyan), the latter estimated from all stars within the half-mass radius. In the second galaxy, the dotted line and the dotted ellipse indicate measurements at 2Re. The axis ratio q denotes the ratio of the semimajor to semiminor axes. In the third column, we show the corresponding high-resolution projected velocity fields, while the fourth column displays the synthetic MaNGA-like velocity fields. These latter were computed on a 0.5 × 0.5 arcsec per pixel grid, based on the interpolation of three dithering fiber configuration illustrated in the top-right corner of the third-column panels. Kinematic position angles (PAkin), derived using the PAFIT package (Krajnović et al. 2006), are indicated with dashed red lines. In the first example, both the optical and kinematic PAs closely trace the direction of the projected stellar spin. In the second example, the optical PA is less reliable due to the near-circular shape of the galaxy at one effective radius (q ≈ 1), while the kinematic PA more accurately captures the spin direction. The third example features a spheroidal galaxy with a kinematically decoupled core (a central stellar component rotating counter to the outer stellar population). This complex structure is not evident from the optical morphology alone, resulting in a more noticeable misalignment of ΔPAgal − opt = 15.2°. The kinematic estimate performs even worse, with ΔPAgal − kin = 22.4° and a substantial 3σPAk uncertainty of 28.2°, likely due to the presence of the decoupled core.
Current usage metrics show cumulative count of Article Views (full-text article views including HTML views, PDF and ePub downloads, according to the available data) and Abstracts Views on Vision4Press platform.
Data correspond to usage on the plateform after 2015. The current usage metrics is available 48-96 hours after online publication and is updated daily on week days.
Initial download of the metrics may take a while.