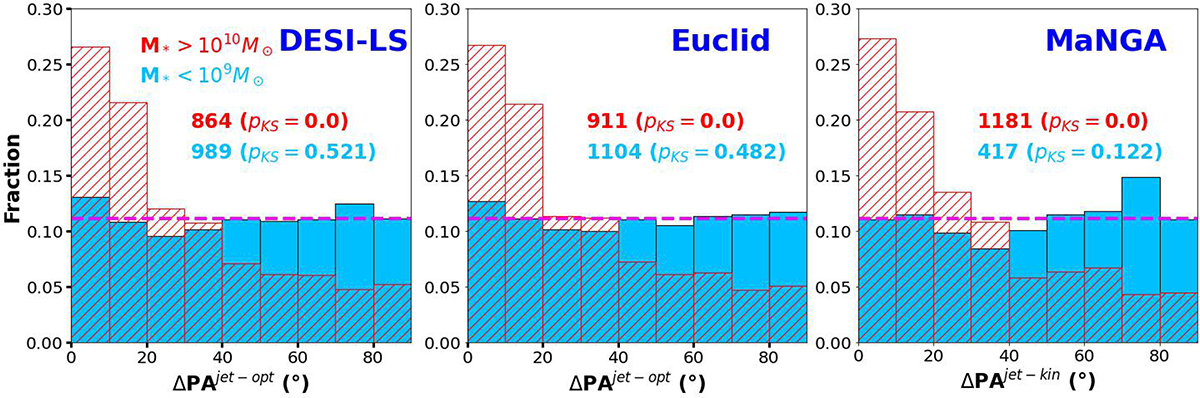
Fig. 7.
Download original image
Same as Fig. 6, but here we distinguish between galaxies with stellar masses below 109 M⊙ and above 1010 M⊙. The numbers indicated in each panel correspond to the sample sizes used to generate the histograms. Values in parentheses denote the KS test pKS values. The results suggest that low-mass galaxies exhibit a more uniform distribution of BH–galaxy misalignment angles (characterized by pKS > 0.05). Note that only good cases are shown, assuming a uniform perturbation of the BH spin of 30°, with no morphological distinction between spheroidal and disk galaxies.
Current usage metrics show cumulative count of Article Views (full-text article views including HTML views, PDF and ePub downloads, according to the available data) and Abstracts Views on Vision4Press platform.
Data correspond to usage on the plateform after 2015. The current usage metrics is available 48-96 hours after online publication and is updated daily on week days.
Initial download of the metrics may take a while.