Fig. 3
Download original image
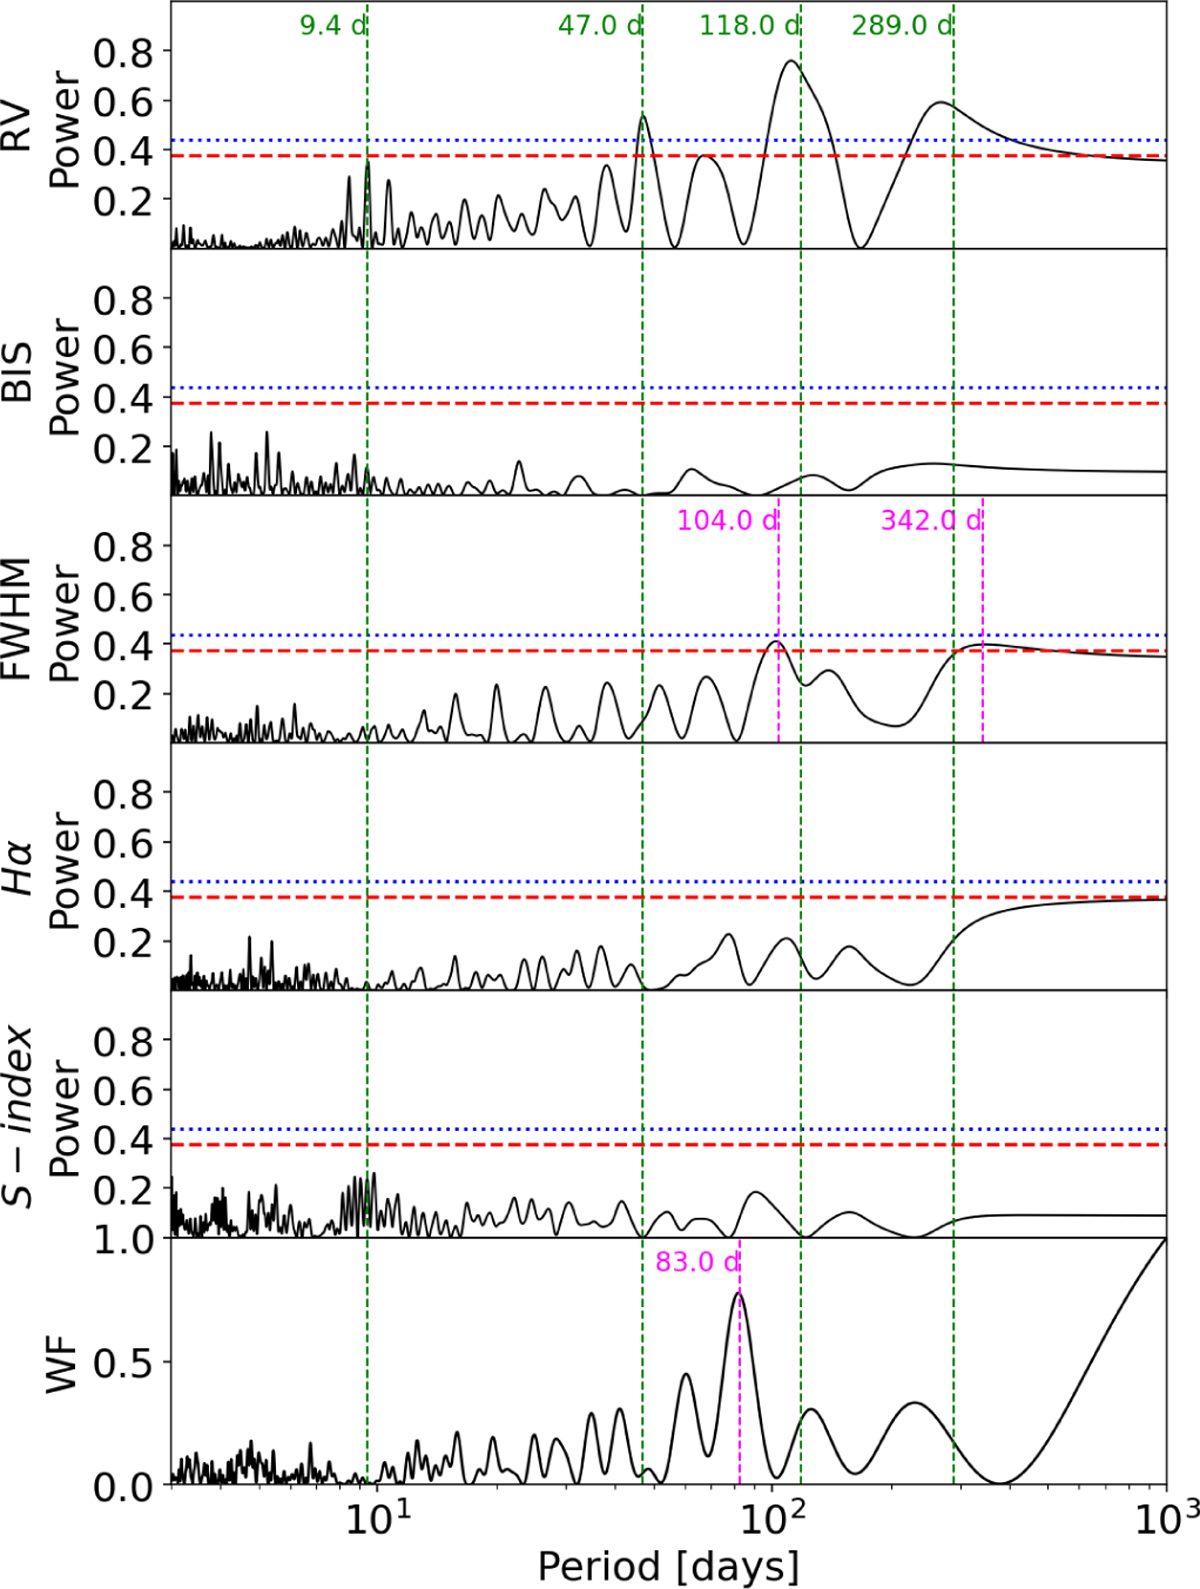
Periodogram of the radial velocities (top) and activity indices (middle), along with the window function of the observations (bottom) for the FEROS data of TOI-375. False-alarm probabilities are indicated by horizontal lines: dashed red for 1% FAP and dotted blue for 0.1% FAP in each panel. The green vertical lines mark peaks in the radial-velocity periodogram with a FAP below 1% or corresponding to a confirmed a priori planetary signal, such as the 9.4-day signal. In contrast, the magenta vertical lines indicate signals that are unlikely to be of planetary origin.
Current usage metrics show cumulative count of Article Views (full-text article views including HTML views, PDF and ePub downloads, according to the available data) and Abstracts Views on Vision4Press platform.
Data correspond to usage on the plateform after 2015. The current usage metrics is available 48-96 hours after online publication and is updated daily on week days.
Initial download of the metrics may take a while.