Fig. 2.
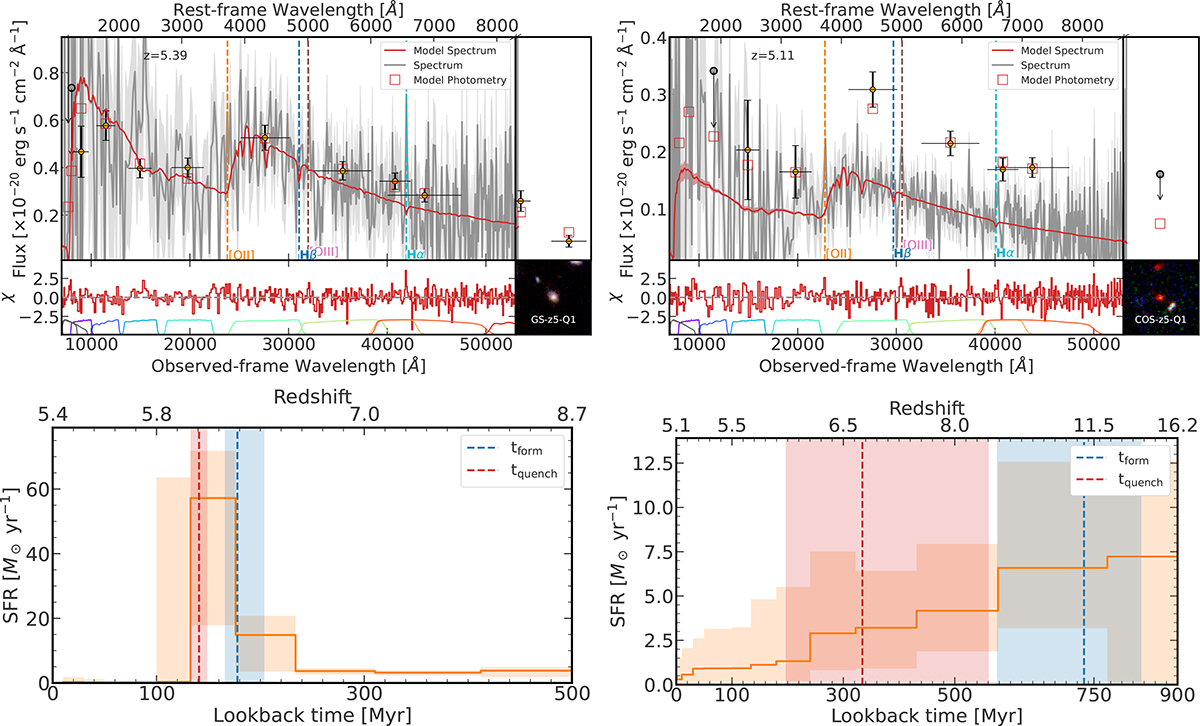
Download original image
Top: Observed 1D NIRSpec prism spectra (grey), photometry (yellow points) and best-fit model spectra and photometry (red) for GS-z5-Q1 (left) and COS-z5-Q1 (right). The MIRI points are shown in the right extension to the figure and correspond to F560W (just GS-z5-Q1) and F770W (both). Bottom-middle: χ values for the spectral fit with the NIRCam filters overplotted (left) and an RGB image of the galaxy (right). Notable emission lines are overplotted. Bottom: SFHs for the two galaxies (orange line) showing SFR against lookback time (redshift). The formation time (t50, the time 50% of the mass is formed) and quenching time (t90, the time 90% of the mass is formed) and overplotted as blue and red lines, respectively.
Current usage metrics show cumulative count of Article Views (full-text article views including HTML views, PDF and ePub downloads, according to the available data) and Abstracts Views on Vision4Press platform.
Data correspond to usage on the plateform after 2015. The current usage metrics is available 48-96 hours after online publication and is updated daily on week days.
Initial download of the metrics may take a while.