| Issue |
A&A
Volume 706, February 2026
|
|
|---|---|---|
| Article Number | A91 | |
| Number of page(s) | 10 | |
| Section | Extragalactic astronomy | |
| DOI | https://doi.org/10.1051/0004-6361/202557207 | |
| Published online | 02 February 2026 | |
Double trouble: Two spectroscopically confirmed low-mass quiescent galaxies at z > 5 in overdensities
1
DARK, Niels Bohr Institute, University of Copenhagen Jagtvej 155A DK-2200 Copenhagen, Denmark
2
Cosmic Dawn Center (DAWN), Denmark
3
DTU Space, Technical University of Denmark, Elektrovej 327 DK-2800 Kgs. Lyngby, Denmark
4
INAF-Osservatorio Astrofisico di Arcetri Largo Enrico Fermi 5 I-50125 Firenze, Italy
5
Niels Bohr Institute, University of Copenhagen Jagtvej 128 DK-2200 Copenhagen North, Denmark
6
Institute for Astronomy, University of Edinburgh, Royal Observatory Edinburgh EH9 3HJ, UK
★ Corresponding author: This email address is being protected from spambots. You need JavaScript enabled to view it.
Received:
11
September
2025
Accepted:
9
December
2025
Abstract
We present the discovery of two low-mass, high-redshift quiescent galaxies, GS-z5-Q1 and COS-z5-Q1, using JWST NIRSpec spectroscopy alongside NIRCam and MIRI photometry. Observed at a redshift of z = 5.39 and z = 5.11, respectively, and with stellar masses of 109.6 M⊙ and 109.5 M⊙, GS-z5-Q1 and COS-z5-Q1 are two of the most distant quiescent galaxies spectroscopically confirmed to date. They are also by far the least massive (∼10× lower mass). Full spectrophotometric modelling has revealed that COS-z5-Q1 appears to have quenched more than 300 Myr prior to observation (z ∼ 7) and has a formation redshift of around z ∼ 11, whilst GS-z5-Q1 formed and quenched in a single burst around 150 Myr prior to observation (z ∼ 6). GS-z5-Q1 is found to lie near the centre of a known high-z overdensity in GOODS-S, as would be expected by galaxy formation models, while COS-z5-Q1 lies towards the outskirts of an overdense region. This highlights the role that environment could play in accelerating galaxy evolutionary processes and could possibly be linked to the galaxies’ quiescent nature. By modelling their stellar populations, we show that these types of low-mass quiescent galaxies could potentially be descendants of the higher z ‘mini-quenched’ galaxies. The discovery of these two low-mass, z > 5 quiescent galaxies illuminates a previously undiscovered galaxy population and motivates further dedicated follow-up surveys to investigate the overall population.
Key words: galaxies: evolution / galaxies: formation / galaxies: general / galaxies: high-redshift / galaxies: star formation
© The Authors 2026
 Open Access article, published by EDP Sciences, under the terms of the Creative Commons Attribution License (https://creativecommons.org/licenses/by/4.0), which permits unrestricted use, distribution, and reproduction in any medium, provided the original work is properly cited.
This article is published in open access under the Subscribe to Open model. This email address is being protected from spambots. You need JavaScript enabled to view it. to support open access publication.
1. Introduction
Quiescent galaxies likely represent an endpoint to the galaxy evolutionary cycle. Bereft of star-forming activity for hundreds of millions of years they provide a compelling test of galaxy evolutionary theory and cosmology (Man & Belli 2018). Prior to JWST, spectroscopically confirmed quiescent galaxies were limited to a few rare examples at z ∼ 4 (e.g. Valentino et al. 2020), but JWST has pushed back the frontier significantly. We have many z > 4 spectroscopically confirmed quiescent galaxies now at hand (e.g. Carnall et al. 2023, 2024; de Graaff et al. 2025b; Baker et al. 2025b; Wu 2025; Nanayakkara et al. 2025; Weibel et al. 2025; Ito et al. 2025a; Zhang et al. 2025). The most distant example found to date was reported at z = 7.3 in Weibel et al. (2025). However, the next highest redshift quiescent galaxy found so far is only at z = 4.9 (de Graaff et al. 2025b). This means that there is a seeming ‘redshift desert’ between z = 4.9 and z = 7.3. However, investigations of quiescent galaxy number densities show that we should still be able to uncover many within this range (e.g. Valentino et al. 2023; Alberts et al. 2024; Baker et al. 2025d). In addition, photometric candidates have been found (e.g. Alberts et al. 2024; Baker et al. 2025d; Stevenson et al. 2026) but have yet to be followed up on with spectroscopy.
However, one key point is that everything spectroscopically confirmed so far is a massive quiescent galaxy with M★ > 1010 M⊙. These are naturally bright and are therefore more readily observed and do not require exceptionally deep spectroscopy. Lower mass, high-z quiescent galaxies have remained an enigma, even with JWST. Unlike the aforementioned massive quiescent galaxies, the highest redshift spectroscopically confirmed lower mass (M★ < 1010 M⊙) quiescent galaxies lie at much lower redshifts (z < 3.5, Sandles et al. 2023; Sato et al. 2024; Baker et al. 2025b). Photometric studies uncover many lower mass (M★ < 1010 M⊙) quiescent galaxies (Valentino et al. 2023; Alberts et al. 2024; Baker et al. 2025d), but due to their intrinsic faintness, the spectroscopy for these sources has been lacking.
The most likely proposed quenching mechanisms are thought to be different for massive and low-mass quiescent galaxy sub-populations. At lower redshifts (z < 2), lower mass quiescent galaxies are thought to be quenched primarily by the environment (Dressler 1980; Peng et al. 2010), while the culprit for massive quiescent galaxies is generally assumed to be some form of AGN feedback (Croton et al. 2006), either ejective or preventive (Fabian 2012; Zinger et al. 2020). Models of quenching can be split into ‘mass’ quenching, primarily affecting massive galaxies (mostly corresponding to AGN feedback in simulations, Vogelsberger et al. 2020), and ‘environmental’ quenching (Alberts & Noble 2022), typically affecting low-mass galaxies (Peng et al. 2010). However, at high z, the amount of time available when a galaxy can become quenched in is shorter1. This could impact the ability of the environment to quench low-mass galaxies, as it would require a rapid environmental mechanism (e.g. mergers, Puskás et al. 2025).
At high redshift, the role of environment is also tightly connected to the growth of protoclusters, the overdense regions that may be the progenitors of the kind of massive clusters observed more locally (Overzier 2016; Alberts & Noble 2022). Many high-z protoclusters are found (e.g. Laporte et al. 2022; Helton et al. 2024a,b; Arribas et al. 2024; Fudamoto et al. 2025; Witten et al. 2025b) with suggestions that the galaxies residing in these protoclusters diverge from field based galaxies, by showing signs of accelerated growth and evolution (Morishita et al. 2025; Witten et al. 2025c). This would make these overdense regions the natural place to find quiescent galaxies (Jespersen et al. 2025) and, as expected, many high-z spectroscopically confirmed quiescent galaxies show signs of residing in overdense regions (McConachie et al. 2022; Tanaka et al. 2024; Glazebrook et al. 2024; Kakimoto et al. 2024; de Graaff et al. 2025b; Carnall et al. 2024; Ito et al. 2025b; McConachie et al. 2025). This suggests that it is crucial to probe the environment of high-z quiescent galaxies to understand their role within the cosmological context.
An additional source of complexity is the discovery of the so-called ‘mini-quenched’ galaxies (Strait et al. 2023; Looser et al. 2024; Baker et al. 2025a; Covelo-Paz et al. 2026). These high-z low-mass galaxies (M★ < 109.0 M⊙), with steep blue UV slopes, weak Balmer breaks, and an absence of strong emission lines, show signs of recent quenching episodes. However, the timescales for these quenching episodes are usually within the last 20–50 Myrs (Looser et al. 2024; Baker et al. 2025a; Covelo-Paz et al. 2026), suggesting only a short period of dormant activity (hence, the steep blue UV slopes and weaker Balmer breaks). These are typically thought to result from bursty star formation and would correspond to periods of possibly temporary quenching before an up tick in star formation (Dome et al. 2024; Gelli et al. 2025).
However, it is an open question as to the role these mini-quenched galaxies play in the galaxy evolutionary cycle. Here, we consider whether they are a distinct population or, instead, a short-lived phase that most galaxies go through. In addition, we want to explore whether such low-mass mini-quenched galaxies could eventually turn into low-mass quiescent galaxies.
In this paper, we confirm the quiescent nature, low masses, and high redshifts of GS-z5-Q1 and COS-z5-Q1, exploring their stellar populations, environments, and possible progenitors. We apply the Chabrier (2003) IMF and Planck Collaboration VI (2020) cosmology throughout this paper.
2. Data and methods
2.1. The targets
GS-z5-Q1 and COS-z5-Q1 were photometrically selected based on the criteria presented in Baker et al. (2025d). Specifically, their extended selection criteria (M* > 109.3 M⊙), which we briefly summarise as follows. Galaxies were selected from five CANDELS fields (Grogin et al. 2011; Koekemoer et al. 2011) and template fit using EAZY (Brammer et al. 2008). High-z quiescent candidate galaxies (with zphot > 2) were selected based on which ones were falling within the extended UVJ-based colour selection region defined by Baker et al. (2025b). This approach, in turn, was developed based on 18 spectroscopically confirmed massive quiescent galaxies from 2 < z < 5. This colour-selected, reduced (but still large) sample was then modelled with the Bayesian spectral energy distribution (SED) modelling tool BAGPIPES (Carnall et al. 2018). Quiescent galaxies were then selected based on an evolving specific star formation rate (sSFR) criterion (Franx et al. 2008; Gallazzi et al. 2014; Carnall et al. 2018; Baker et al. 2025b), expressed as
 (1)
(1)
where tage is the age of the universe at the observed redshift and sSFR 100 Myr is the sSFR averaged over the past 100 Myr.
Figure 1 (left) shows the final extended selection sample from Baker et al. (2025d) as the grey-scaled background points on a classic UVJ colour selection diagram. The Baker et al. (2025b) extended UVJ selection criteria is shown by the dotted red line. Also shown is the Schreiber et al. (2015) and Belli et al. (2019) selection criteria as the black dashed lines and grey dashed line respectively. As detailed in Baker et al. (2025d), they uncover many more low-mass quiescent galaxies with this extended selection followed by their Bayesian-based stellar population modelling approach and sSFR cut (Eq. (1)), than would be selected by the more traditional (low-redshift based) criteria.
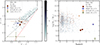 |
Fig. 1. Left: UVJ colour diagram. GS-z5-Q1 and COS-z5-Q1 are indicated with full red circles, along with the sources in Weibel et al. (2025), Looser et al. (2024), de Graaff et al. (2025b) as labelled. The background grey-scaled sources are QG candidates at z > 2 from Baker et al. (2025d), where the mass cut has been relaxed (M★ > 109.3 M⊙). Right: Same galaxies as on the left are shown in the stellar mass versus redshift plane. Quiescent galaxies with JWST medium/high-resolution spectra compiled in Ito et al. (2025a) are also shown in squares. It highlights how low-mass GS-z5-Q1 and COS-z5-Q1 are compared to the de Graaff et al. (2025b) galaxy at z = 4.9, i.e. almost 1.5 dex less massive, despite having similar colours and redshifts. |
The Baker et al. (2025d) extended photometric catalogue was then cross-matched with the available spectra on the Dawn JWST Archive (DJA2) and GS-z5-Q1 and COS-z5-Q1 were identified. Their positions in the UVJ diagram in Fig. 1 show that they fall out of the classic Schreiber et al. (2015) UVJ criteria but fall into the Belli et al. (2019) and Baker et al. (2025b) criteria3. Figure 1 lower panel shows GS-z5-Q1 and COS-z5-Q1 in the stellar mass versus redshift plane4. It shows that GS-z5-Q1 and COS-z5-Q1 are over an order of magnitude less massive than the de Graaff et al. (2025a)z = 4.9 massive quiescent galaxy despite having similar UVJ colours and residing at a similar redshift. They reside over 0.6 dex below even the z = 7.3 Weibel et al. (2025) galaxy, highlighting just how low-mass these two quiescent galaxies are. Despite this, they remain more massive than the typical high-redshift mini-quenched galaxies by around 0.5–0.7 dex (Looser et al. 2024; Baker et al. 2025a).
Based on the well-established evolving sSFR criteria shown in Eq. (1) (alongside other metrics, e.g. the higher z UVJ colour selections), both GS-z5-Q1 and COS-z5-Q1 are clearly classified as quiescent galaxies. Due to an almost complete lack of star formation over the past 100 Myr, they would still be classified as quiescent even after sSFR cuts over shorter timescales (e.g. 50 Myr) and this point is further enforced by their strong Balmer breaks in both spectroscopy and photometry, as seen in Fig. 2.
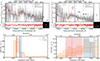 |
Fig. 2. Top: Observed 1D NIRSpec prism spectra (grey), photometry (yellow points) and best-fit model spectra and photometry (red) for GS-z5-Q1 (left) and COS-z5-Q1 (right). The MIRI points are shown in the right extension to the figure and correspond to F560W (just GS-z5-Q1) and F770W (both). Bottom-middle: χ values for the spectral fit with the NIRCam filters overplotted (left) and an RGB image of the galaxy (right). Notable emission lines are overplotted. Bottom: SFHs for the two galaxies (orange line) showing SFR against lookback time (redshift). The formation time (t50, the time 50% of the mass is formed) and quenching time (t90, the time 90% of the mass is formed) and overplotted as blue and red lines, respectively. |
2.2. Photometry and spectroscopy
The photometry and spectroscopy of the targets were both retrieved from the DJA. We adopted the photometry from the most updated v7 version available in PRIMER-COSMOS (v7.4, GO Program ID #1837, PI: J. Dunlop) and GOODS-S (v7.2). JWST and HST images were reduced with GRIZLI (Brammer 2023) following the procedures detailed in Valentino et al. (2023). The photometry was extracted in circular apertures with a diameter of  and corrected to the total values within an elliptical Kron aperture Kron (1980). We further applied the zeropoint corrections iteratively computed with EAZYPY (Brammer et al. 2008) and available on the DJA. As noted elsewhere (Ito et al. 2025a; Valentino et al. 2025), adopting photometry extracted on PSF-matched images does not introduce any significant colour correction, but can increase the overall normalization by ≈10%. This does not affect the primary conclusions of this work. The observed photometry used in the fitting (including the error floor correction) is presented in Table 1.
Observed photometry of GS-z5-Q1 and COS-z5-Q1.
The PRISM/CLEAR spectra were retrieved from the v4.3 release of DJA5 (Valentino et al. 2025; Pollock et al. 2025) and reduced with MSAEXP as described in detail in de Graaff et al. (2025b) and Heintz et al. (2025). GS-z5-Q1 was observed as part of the spectroscopic campaign described in Barrufet et al. (2025, PID #2198; PIs: L. Barrufet & P. Oesch). The low-resolution spectrum (R ∼ 100) was obtained integrating for 2451s dithered along three microshutters. COS-z5-Q1 was obtained as part of the CANDELS-Area Prism Epoch of Reionization Survey (CAPERS, Kokorev et al. 2025; PID #6368, PI: M. Dickinson). The target benefitted from the deep-tier setup and was observed for 17069s with the PRISM-CLEAR. The photometry and spectra of both targets are shown in Fig. 2.
2.3. SED modelling with PROSPECTOR
We jointly modelled the spectra and photometry with PROSPECTOR (Johnson et al. 2021), which uses the FSPS stellar population synthesis code (Conroy et al. 2009; Conroy & Gunn 2010) as its basis. Following the configuration of Tacchella et al. (2022) and similar to that of Baker et al. (2025b), we adopted a flexible non-parametric continuity SFH (Leja et al. 2019a) with 12 lookbacktime bins, where we fit for the ratio between the bins. The prior is a student-t distribution with a width of 0.3. We also used a Chabrier (2003) IMF and Calzetti et al. (2000) dust law, with AV allowed to vary freely between 0–3 magnitudes. We left the log stellar metallicity free to vary between −2.0 and 0.19 such that log(Z/Z⊙) = (−2.0, 0.19).
Redshifts were allowed to freely vary around the spectroscopic value determined with MSAEXP (z = 5.11 and 5.39 for COS-z5-Q1 and GS-z5-Q1, respectively, Table 2), following a Gaussian with width 0.05. We also tested leaving redshifts free to vary from z = 1 − 10 and found consistent redshifts. We marginalised over the nebular emission lines. Both the photometry and NIRSpec spectra were jointly fit, with a second-order polynomial accounting for offsets (for more details on the polynomial fit, see Baker et al. 2025b). We adopted a 10% error floor on the photometry. The parameter inference was performed via a dynamic nested sampling procedure with DYNESTY (Speagle 2020).
Properties of GS-z5-Q1 and COS-z5-Q1.
3. Results
3.1. Stellar population properties
Figure 2 (top) shows the observed and best-fit model spectra and photometry for GS-z5-Q1 (left) and COS-z5-Q1 (right). We once again see that the spectra and photometry for both sources have strong Balmer breaks, confirming the galaxies’ quiescent nature. Neither galaxy displays evidence of strong emission lines, although the position of these lines is overplotted. We also have additional constraints on the NIR for the two galaxies from the MIRI filter coverage and the NUV from Hubble. This helps to rule out any strong contribution from an AGN component (e.g. a contribution from a hot torus at ∼ 1 μm).
The bottom panel of Fig. 2 shows the star formation histories (SFHs) for the two sources. Orange corresponds the 50th percentile of the best-fit SFHs with the errors corresponding to the 16th percentile and 84 percentiles. The red and blue lines correspond to the quenching and formation times, which are given by the time taken to form 90% and 50% of the total stellar mass, respectively.
We can see two contrasting SFHs for the two sources, with COS-z5-Q1 having a much more extended SFH, as well as significantly greater uncertainty on the formation and quenching times. This is also reflected in the shape of the SFH, which might be influenced by the ‘continuity’ SFH prior for this source. Despite this, it would appear to have an early formation and quenching time, consistent with having formed anywhere from z = 9 to z = 11 and quenched sometime from z = 6 − 9. The SFH for GS-z5-Q1 appears completely different. The best-fit model indicates a relatively recent short sharp burst of star formation that accounts for almost the entire SFH. GS-z5-Q1 has a much younger formation and quenching time of around 150 Myr prior to observation (e.g. around z ∼ 6).
Both SFHs are physically plausible, galaxies with similar SFR ≥ 40 M⊙/yr to GS-z5-Q1 have been observed at z ∼ 6. Although, far above the normal star-forming galaxy population (Simmonds et al. 2025), a SFR ≥ 40 M⊙/yr is still well within the region for dusty-star-forming galaxies (Casey et al. 2014; Gottumukkala et al. 2024) and far below that reached by the most extreme examples (e.g. Zavala et al. 2018). The situation for COS-z5-Q1 is different as it requires a steady SFR over a longer period, but we do see evidence for galaxies with SFR ∼ 5 M⊙ around z ∼ 10 (Roberts-Borsani et al. 2024). Intriguingly, this opens up the possibility that COS-z5-Q1 could be a descendent of the UV bright galaxies observed at z > 10 (e.g. Curtis-Lake et al. 2023; Castellano et al. 2024; Carniani et al. 2025; Naidu et al. 2025).
However, obtaining accurate SFHs and formation and quenching times is complicated with only NIRSpec prism spectra (Baker et al. 2025b; Nanayakkara et al. 2025; de Graaff et al. 2025b). The prism spectra themselves are unable to constrain the stellar metallicity (which is left free to vary within reasonable bounds; see Sect. 2.3) and is itself degenerate with stellar population age.
Another important caveat to this approach of spectral fitting is that it assumes an entirely in-situ SFH. As highlighted in Cochrane (2025), mergers are fully expected at high-z due to hierarchical structure formation (White & Rees 1978). Hence, the impact on stellar population properties could be profound.
However, importantly, we can robustly constrain our galaxy stellar masses to M★ < 1010 M⊙ with our full-spectrophotometric fitting with PROSPECTOR. The reason for this is twofold. Firstly, we are using the ‘continuity’ style SFH prior, which is known to increase galaxy stellar masses by 0.1–0.2 dex compared with other SFHs (Leja et al. 2019a,b). Secondly, the situation outlined in Cochrane (2025) serves to lead to stellar mass overestimates rather than underestimates. Therefore, should our stellar masses be affected by these two problems, we would expect them to be revised to lower values rather than higher values. This means that the low-mass nature of these two sources should be robust against these SED modelling assumptions.
3.2. Spectral properties
In this section, we explore the properties of the NIRSpec spectra of COS-z5-Q1 and GS-z5-Q1. We started by measuring the βUV slope. We followed the combined fitting procedure of Baker et al. (2025a) along with that of Saxena et al. (2024). Thus, our approach consisted of fitting a powerlaw of the form F ∝ λUVβ within a window of 1600 Å−2800 Å. However, we also masked the regions 1620 Å−1680 Å and 1860 Å−1980 Å in order to remove potential line contribution (Saxena et al. 2024). We reported the values in Table 2. We see that both galaxies are consistent with much redder UV slopes, with βUV = −0.72 ± 0.23 for GS-z5-Q1, and βUV = −1.63 ± 0.32 for COS-z5-Q1, than the values that are typically seen for galaxies in this redshift range (Roberts-Borsani et al. 2024; Heintz et al. 2025). This highlights a lack of recent star formation when compared to other more recently quenched galaxies, such as in Looser et al. (2024) and Baker et al. (2025a).
We also explored the potential emission line contribution, with a particular focus on Hα as it is such a well known tracer of recent star formation (on timescales of ∼10 Myr, Kennicutt 1998; Kennicutt & Evans 2012). This enabled us to place a constraint on the recent star formation activity independently of the SED modelling assumptions. We fit the continuum subtracted prism spectrum with a Gaussian, assuming that all the flux within the Hα region is associated with Hα (i.e. with no blended [NII] contribution). We find a 2.8σ Hα detection. Converting this into a SFR assuming a Wilkins et al. (2019) conversion factor (although results also remain consistently low with a Kennicutt & Evans 2012, conversion factor) this gives us an SFR < 1 M⊙ yr−1 for both galaxies, as shown in Table 2. This once again highlights the quiescent nature of both GS-z5-Q1 and COS-z5-Q1 reiterating that they have not undergone any recent star formation.
3.3. Size and morphology
The next aspect to explore is the morphologies of these two quiescent galaxies based on the NIRCam imaging. We modelled the surface brightness profiles of the two galaxies with the fitting tool PYSERSIC (Pasha & Miller 2023)6. The images were retrieved from the DJA and the PSFs from Genin et al. (2025).
Based on the imaging, GS-z5-Q1 is both isolated and extended; hence, a single Sersic (1968) profile is sufficient to reproduce the observed light profile. The model in each band returns consistent radii and Sérsic indices, proving that the target is well detected. Figure 3 shows the model and the residuals in NIRCam/F277W, corresponding to a rest-frame wavelength of ≈4500 Å. This is the bluest NIRCam wide-band filter available on the red side of the Balmer break. We saw no significant residuals. GS-z5-Q1 is disky ( , with an ellipticity of
  ) and resolved (
 kpc). Modelling a point source model returns significant structured residuals on extended scales.
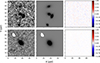 |
Fig. 3. Sérsic modeling of the surface brightness in NIRCam/F277W of COS-z5-Q1 (top) and GS-z5-Q1 (bottom). In each row, the first panel shows the image in pixel units (3″ side, |

As opposed to GS-z5-Q1, the imaging shows that COS-z5-Q1 is not isolated and has neighbouring sources. These additional sources have different photometric redshifts that are inconsistent with z = 5.11; thus, a chance alignment would be favoured in such cases over any physical association. We modelled COS-z5-Q1 along with the nearby sources to avoid blending and contamination due to imperfect masking (even if minimal). In this case, a simple model with a point source performs only marginally worse than a Sérsic profile, since the object is compact and faint. The size estimate should thus be taken with a grain of salt and more conservatively considered as an upper limit. For COS-z5-Q1, we estimated  kpc, along with a high Sérsic index of
  and an ellipticity of
  in the F277W band.
Neither galaxy shows any sign of central bulges or cores (e.g. van Dokkum et al. 2014; Tacchella et al. 2015; Baker et al. 2025c) and each of them can be fit well with single-component models. Both sources appear to be extended compared to the extrapolation of the stellar mass-size relation derived at z > 3 (Ito et al. 2024; Kawinwanichakij et al. 2025; Baker et al. 2025b). The effective semi-major axis estimates are also ∼1.5 − 5 × larger than the sizes reported for the quenched systems at z ≳ 5 discussed in Weibel et al. (2025) and de Graaff et al. (2025b). However, it is now rather well-established that the mass-size relation tends to flatten at low stellar masses at lower redshifts (Hamadouche et al. 2025; Cutler et al. 2024). Coupled with their possible disc-like structure (especially evident for GS-z5-Q1) and taking advantage of the deeper imaging available in the field, sources at intermediate masses might represent the connection with the blue star-forming population after quenching, as reported at 3 < z < 4 (Sato et al. 2024).
4. Discussion
4.1. The role of environment
As mentioned in the introduction, many quiescent galaxies show signs of residing in overdensities. Hence, it is important to probe the surrounding environment of GS-z5-Q1 and COS-z5-Q1.
In this section, we investigate the environment around these two targets. We used the photometric redshift catalogues from the DJA in the GOODS-S and PRIMER-COSMOS field to draw a density map around GS-z5-Q1 and COS-z5-Q1. To ensure the quality of the SED fitting and high completeness of the sample in the entire field, we applied a stellar mass cut of log(M★/M⊙) > 8 and a redshift quality cut of (zphot, 84 − zphot, 16)/zphot, 50 < 1. Here, zphot, 16, zphot, 50, and zphot, 84 represent the 16, 50, and 84 percentile of the probability distribution of the photometric redshift. All of these quantities were derived with EAZY-PY (see Valentino et al. 2023, for more detail of the configuration). Moreover, we used the spectroscopic redshift of all objects that have a robust (grade = 3) estimate in the DJA spectroscopic compilation. To select galaxies at a similar redshift to the targets, we considered sources with a specific redshift, such that zQG − σNMAD < z < zQG + σNMAD, where zQG is the redshift of the target and σNMAD is the normalised median absolute deviation between the photometric and spectroscopic redshifts (Brammer et al. 2008). We also tested varying the threshold to zQG − 0.05 < z < zQG + 0.05, and the more traditional zQG − 3 × σNMAD < z < zQG + 3 × σNMAD, finding that the significant overdensities remain regardless of these variation in the threshold. We derived the local surface galaxy density map around COS-z5-Q1 and GS-z5-Q1 by counting galaxies within a 500 pkpc aperture at the position. We note that the edge of the field in the survey was masked out during the calculation. The overdensity (i.e. N − ⟨N⟩, where N is the number of galaxies within the aperture at the position) was calculated by using the average number, ⟨N⟩.
Figure 4 shows the distribution of galaxies around the COS-z5-Q1 and GS-z5-Q1. Interestingly, we find that the GS-z5-Q1 is in a significant overdense structure with ∼5σ significance of the peak based on the most constrained redshift window of 0.05. With the wider σNMAD window this decreases to a significance of ∼3σ (which is expected since widening the redshift range smooths out the real overdensity.) This dense structure at z = 5.4 has been previously reported in Helton et al. (2024a) where they find 39 members in the wider overdensity. Based on the overdensity members, Helton et al. (2024a) estimated a halo mass of around 12.6 < log(Mhalo/Ṁ) < 12.8, but as they did not have access to prism spectroscopy, they were unable to confirm GS-z5-Q1 as a member of this structure.
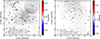 |
Fig. 4. Distribution of galaxies around the GS-z5-Q1 (left) and COS-z5-Q1 (right). These QGs are located in the centre of the field and marked as stars. The coloured circles and smaller black circles correspond to galaxies at 5.26 < z < 5.52 (for GS-z5-Q1) and 4.99 < z < 5.23 (for COS-z5-Q1) according to their spectroscopic and photometric redshift, respectively. The contours show the overdensity measured from photometric and spectroscopic galaxies. The number in these contours indicates the significance of the overdensity. For GS-z5-Q1, the location of the overdensity centre reported in Helton et al. (2024a) is shown as a green square. |
As can be seen in the right-hand panel of Fig. 4, COS-z5-Q1 is found to be located at the edge of an overdense structure of galaxies. This suggests that both GS-z5-Q1 and COS-z5-Q1 could lie within a high-z protocluster.
These results are intriguing, particularly given the low masses of these two quiescent galaxies compared to other quiescent galaxies at similar redshifts (e.g. de Graaff et al. 2025b). Locally, low-mass galaxies are commonly thought to be quenched via environmental processes (possibly up to z ∼ 2, Sandles et al. 2023). Thus, signs of low-mass quiescent galaxies residing in overdense region opens up the possibility of high-z environmental quenching. This could take the form of galaxy harassment (Moore et al. 1996), mergers, or other well-known environmental quenching processes (Alberts & Noble 2022).
We note, however, that just because a low-mass quiescent galaxy lies within an overdense region does not necessarily indicate that it was quenched via environmental processes (Alberts & Noble 2022) as there are many other secular quenching processes that could have led to quiescence7. The situation for lower mass quiescent galaxies is even more poorly understood due to a lack of spectroscopic detections. Another aspect to consider is that whilst these galaxies are low-mass compared to other detected quiescent galaxies at similar redshifts, when compared to the other galaxies within the overdense region, they are not necessarily particularly ‘low-mass’. They might even be the most massive galaxy within the potential protocluster, possibly limiting the environmental quenching mechanisms that could have shut down star formation. This would appear to be less likely for COS-z5-Q1 due to its position on the edge of the overdensity as opposed to a more central region, However, as previously mentioned (and shown in Fig. 4), GS-z5-Q1 lies towards the centre of the overdensity. In addition, in Helton et al. (2024a), where they report and investigate this overdensity that GS-z5-Q1 resides in, they also reported SED modelled stellar masses for the overdensity members that they spectroscopically confirm. They did not report any stellar masses greater than that of GS-z5-Q1; in fact, their highest reported overdensity member mass is also M∗ ≈ 109.6 M⊙ (i.e. similar to GS-z5-Q1). This opens up the possibility that GS-z5-Q1 is part of a potential protocluster core. Further spectroscopy of protocluster members would be required to confirm this scenario.
Even in the case that residing in an overdensity does not mean environmental quenching, it is still intriguing that so many high-z quiescent galaxies lie in such overdense regions (e.g. Glazebrook et al. 2017; de Graaff et al. 2025b; Ito et al. 2025b; Carnall et al. 2024; McConachie et al. 2025). It is thought that protocluster environments can accelerate galaxy evolutionary processes (Morishita et al. 2025; Witten et al. 2025c) leading to more mature galaxies compared to the field, which may be what we are seeing here for GS-z5-Q1 and COS-z5-Q1. Further spectroscopic follow-up would be required to test this.
Another possibility is that this purely relates to their masses. More massive galaxies are expected to form in overdense environments (Jespersen et al. 2025), whilst (at least more locally) we also see evidence for a mass dependence in quenching (Peng et al. 2010; Kawinwanichakij et al. 2017), with more massive galaxies more likely to be quiescent.
However, another important consideration relating to the number of quiescent galaxies seen in overdensities, is that these regions could be preferentially targeted for follow-up spectroscopy because of their large abundance of interesting galaxies. Follow up surveys of high-z quiescent galaxies selected via complete photometric samples will test this scenario.
4.2. Connection to mini-quenched galaxies
One of the most exciting early discoveries with JWST was the finding of the high-z, very low-mass (M★ < 109.0 M⊙) recently quenched galaxies, now commonly referred to as ‘mini-quenched’ (Strait et al. 2023; Dome et al. 2024; Looser et al. 2024; Baker et al. 2025a; Covelo-Paz et al. 2026; Gelli et al. 2025). However, these galaxies present very different spectral quantities compared to what we typically think of as quiescent galaxies.
An example of this is shown clearly in Fig. 5, where we present the typical mini-quenched galaxy spectra from Looser et al. (2024) alongside two well-known massive quiescent galaxy spectra from de Graaff et al. (2025b) and Weibel et al. (2025). We also plot the spectra for GS-z5-Q1 and COS-z5-Q1 from this work.
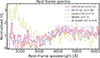 |
Fig. 5. Comparison between GS-z5-Q1, COS-z5-Q1, and three sources from the literature. These are a low-mass ‘mini-quenched’ galaxy from Looser et al. (2024), a massive quiescent galaxy at z = 4.9 from de Graaff et al. (2025b) and the current highest-redshift massive quiescent galaxy spectrum from Weibel et al. (2025). The spectra have been rebinned and renormalised to deal better with noise and improve clarity. It shows that GS-z5-Q1 and COS-z5-Q1 are consistent with the spectral shapes of the Weibel et al. (2025) and de Graaff et al. (2025b) spectra, but are completely different to the classic Looser et al. (2024) ‘mini-quenched’ galaxy spectrum. GS-z5-Q1 and COS-z5-Q1 have red UV slopes and more prominent Balmer breaks whereas the Looser et al. (2024) galaxy has a much steeper UV slope and significantly weaker Balmer break. |
As seen in Fig. 5, the differences between the mini-quenched Looser et al. (2024) spectrum and that of the four quiescent galaxies is immediately apparent. The Looser et al. (2024) galaxy has a significantly bluer UV slope with a value of β = −2.09, alongside a weaker Balmer break compared to all four quiescent galaxies. Other mini-quenched galaxies have been shown to have even bluer β slopes than the Looser et al. (2024) galaxy, with the highest redshift example reaching β = −2.8 (Baker et al. 2025a). This blue UV slope is seen in the UVJ diagram in Fig. 1 (upper panel), where we see the extremely blue U − V colour of the Looser et al. (2024) galaxy compared to the other four quiescent galaxy sources.
This can easily be understood by the more recent star formation and quenching times of the mini-quenched galaxies compared to the much longer quenched period of the quiescent galaxies > 100 Myr. The UV slope traces star formation on a 50–100 Myr timescale (among other properties, e.g. Bruzual & Charlot 2003; Wilkins et al. 2011); hence, is much steeper in galaxies with recent SF within the last 100 Myrs. The opposite is true for the Balmer break, as it can be washed out by recent star formation in a process known as ‘outshining’ (Sawicki & Yee 1998)8.
An open question remains as to what happens to these mini-quenched galaxies after observation. Their existence is commonly explained as a product of bursty star formation (e.g. Looser et al. 2025; Endsley et al. 2024, 2025; Langeroodi 2024; Dome et al. 2024) whereby they represent the downturn stage of the cycle (Trussler et al. 2025; Gelli et al. 2025). This implies that they remain mini-quenched for a short period before an upturn in star formation occurs and they reignite (Witten et al. 2025a). However, the finding in this work of two lower mass massive quiescent galaxies opens up the intriguing possibility that the mini-quenched galaxies observed at higher z are close progenitors to the low-mass quiescent galaxies.
With this in mind, we can go on to explore whether the Looser et al. (2024) galaxy could turn into a lower mass quiescent galaxy such as COS-z5-Q1 or GS-z5-Q1. We cannot just let the stellar populations in the Looser et al. (2024) galaxy age as that galaxy has a mass of 108.7 M⊙ and our lowest mass quiescent galaxy has 109.5 M⊙. This implies we require a 0.8dex growth in the stellar mass; hence, we require some amount of star formation rejuvenation9.
The first thing to look at is the star formation histories of COS-z5-Q1 and GS-z5-Q1. Overall, GS-z5-Q1 appears more consistent with being recently formed and quenched and whilst this does not rule it out as a descendent (any previous SF before the burst could have been thoroughly erased), it does suggest the GS-z5-Q1 progenitor is likely to have much higher star formation rates (e.g. some form of dusty star-forming galaxy, Casey et al. 2014). Therefore, we focus on COS-z5-Q1 which has a quenching time of around 300 Myr. This quenching time is consistent with observations of the z = 7.3 massive quiescent galaxy in Weibel et al. (2025) and indirectly with the dust removal timescales at z ∼ 5 (Leśniewska et al. 2025). This highlights the fact that this quenching timescale is plausible for quiescent galaxies at this redshift.
To model the galaxies, we used FSPS (Conroy et al. 2009; Conroy & Gunn 2010) in order to create two z = 7.3 stellar populations in order to mimic the spectrum of the Looser et al. (2024) mini-quenched galaxy. The age of the stellar populations correspond to the formation and quenching time of the galaxy (as inferred by their PROSPECTOR fit) respectively. This FSPS model is shown alongside the normalised Looser et al. (2024) spectrum in the left hand panel of Fig. 6.
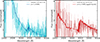 |
Fig. 6. Left: z = 7.3 Looser et al. (2024) mini-quenched galaxy spectrum with an appropriate same redshift FSPS model overplotted (red). Right: COS-z5-Q1 observed spectrum with the same FSPS model, only with the addition of a burst and with stellar population aged from z = 7.3 to z = 5.1. It shows that it is possible to the evolution of a mini-quenched galaxy into a low-mass quiescent galaxy with minimal assumptions. |
We then produced the same model at z = 5.1, where the stellar populations are aged accordingly. To match the stellar mass of COS-z5-Q1 we introduced an extra stellar population with an age of 300 Myr (corresponding to the COS-z5-Q1 quenching time); thus, the overall stellar population model has the same mass as COS-z5-Q1. The resulting FSPS model is shown in the right-hand panel of Fig. 6 alongside the spectrum of COS-z5-Q1. We see that this model provides a qualitatively good fit to the normalised COS-z5-Q1 spectrum, with a significantly redder UV slope and a much stronger Balmer break compared to the original mini-quenched model shown in the left panel.
The point of this exercise is not so much to confirm its progenitor nature as it is to show that under simple modelling assumptions, it is possible to produce a high-z quiescent galaxy (as the one we observe in this work) from a lower mass mini-quenched galaxy observed at a higher redshift.
A full statistical analysis of these two populations (high-z mini-quenched galaxies and low-mass quiescent galaxies) will require much larger spectroscopic samples and motivates dedicated follow-up programmes. This is likely to be addressed on the mini-quenching side by programmes such as OASIS (PID:#5997, PI: T. Looser, Looser+, in prep) and Sleeping Beauties (PID:#7511, PI: A. Covelo-paz & P. Oesch), but requires the addition of dedicated programmes to uncover low-mass, high-z quiescent galaxy population.
5. Conclusions
In this work, we present GS-z5-Q1 and COS-z5-Q1, two low-mass, high-z (z > 5) spectroscopically confirmed quiescent galaxies. We modelled their stellar population properties and morphologies, and we explored their environments. Our conclusions are as follows:
-
We report the discovery of two of the highest redshift quiescent galaxies. With redshifts of z = 5.39 and z = 5.11, GS-z5-Q1 and COS-z5-Q1 stand as two of the most distant quiescent galaxies that have been confirmed and characterised using NIRSpec spectroscopy.
-
GS-z5-Q1 and COS-z5-Q1 are by far the lowest mass, high-z quiescent galaxies probed to date with stellar masses of 109.6 M⊙ and 109.5 M⊙, respectively. This is almost an order of magnitude less than other comparable spectroscopically confirmed quiescent galaxies at similar redshifts and 0.6 dex lower than the highest-redshift spectroscopically confirmed quiescent galaxy known.
-
The star formation histories for GS-z5-Q1 and COS-z5-Q1 are very different with COS-z5-Q1 consistent with an extended SFH, with a formation redshift of z ∼ 10 and a quenching redshift of z ∼ 7, whilst GS-z5-Q1 appears to have formed and quenched in a single burst approximately 150 Myr prior to observation at z ∼ 6. This suggests two different progenitors and quenching mechanisms for these galaxies.
-
After exploring their environments, we confirm GS-z5-Q1 lies at the heart of a known overdensity at z = 5.39 in GOODS-S. We show that GS-z5-Q1 lies at the centre of this overdense and (plausibly) protocluster region, suggesting the environment could be contributing to its accelerated evolution. In addition COS-z5-Q1 also lies at the edge of an overdense region. This opens up the possibility of environmental quenching playing a role at high-z or at least accelerating galaxy evolution compared to the field.
-
We show that the higher z, lower mass ‘mini-quenched’ galaxies are possible progenitors of the kind of low-mass quiescent galaxies we uncovered, with minimal modelling assumptions. This suggests that the mini-quenched galaxies could be close to becoming quiescent for an extended period of time.
The discovery of these two low-mass, z > 5 quiescent galaxies illuminates a previously undiscovered galaxy population. Follow-up analyses and surveys of these systems and other candidates are crucial to solve the mystery of low-mass galaxy quenching and the possible role of the environment within the process.
Data availability
The raw JWST data is available via the DAWN JWST Archive (DJA).
Acknowledgments
WMB would like to acknowledge support from DARK via the DARK Fellowship. This work was supported by a research grant (VIL54489) from VILLUM FONDEN. Some of the data products presented herein were retrieved from the Dawn JWST Archive (DJA). DJA is an initiative of the Cosmic Dawn Center, which is funded by the Danish National Research Foundation under grant DNRF140. KI, FV, and PZ acknowledge support from the Independent Research Fund Denmark (DFF) under grant 3120-00043B. This study was supported by JSPS KAKENHI Grant Number JP23K13141. We acknowledge use of ASTROPY (Astropy Collaboration 2013), FSPS (Conroy et al. 2009; Conroy & Gunn 2010), EAZY (Brammer et al. 2008), GRIZLI (Brammer 2023), PYSERSIC (Pasha & Miller 2023), NUMPY (Harris et al. 2020), DYNESTY (Speagle 2020), MATPLOTLIB (Hunter 2007), and TOPCAT (Taylor et al. 2005). This work is based [in part] on observations made with the NASA/ESA/CSA James Webb Space Telescope. The data were obtained from the Mikulski Archive for Space Telescopes at the Space Telescope Science Institute, which is operated by the Association of Universities for Research in Astronomy, Inc., under NASA contract NAS 5-03127 for JWST. These observations are associated with program #2198 (Barrufet et al. 2025), #6368 (Kokorev et al. 2025), #1180, #1210, and #1286 (Eisenstein et al. 2023; Rieke et al. 2023), and #1837 (Donnan et al. 2024).
References
- Alberts, S., & Noble, A. 2022, Universe, 8, 554 [Google Scholar]
- Alberts, S., Williams, C. C., Helton, J. M., et al. 2024, ApJ, 975, 85 [Google Scholar]
- Arribas, S., Perna, M., Rodríguez Del Pino, B., et al. 2024, A&A, 688, A146 [NASA ADS] [CrossRef] [EDP Sciences] [Google Scholar]
- Astropy Collaboration (Robitaille, T. P.) 2013, A&A, 558, A33 [NASA ADS] [CrossRef] [EDP Sciences] [Google Scholar]
- Baker, W. M., D’Eugenio, F., Maiolino, R., et al. 2025a, A&A, 697, A90 [NASA ADS] [CrossRef] [EDP Sciences] [Google Scholar]
- Baker, W. M., Lim, S., D’Eugenio, F., et al. 2025b, MNRAS, 539, 557 [Google Scholar]
- Baker, W. M., Tacchella, S., Johnson, B. D., et al. 2025c, Nat. Astron., 9, 141 [Google Scholar]
- Baker, W. M., Valentino, F., Lagos, C. d. P., et al. 2025d, A&A, 702, A270 [NASA ADS] [CrossRef] [EDP Sciences] [Google Scholar]
- Barrufet, L., Oesch, P. A., Marques-Chaves, R., et al. 2025, MNRAS, 537, 3453 [Google Scholar]
- Belli, S., Newman, A. B., & Ellis, R. S. 2019, ApJ, 874, 17 [Google Scholar]
- Brammer, G. 2023, https://doi.org/10.5281/zenodo.8370018 [Google Scholar]
- Brammer, G. B., van Dokkum, P. G., & Coppi, P. 2008, ApJ, 686, 1503 [Google Scholar]
- Bruzual, G., & Charlot, S. 2003, MNRAS, 344, 1000 [NASA ADS] [CrossRef] [Google Scholar]
- Calzetti, D., Armus, L., Bohlin, R. C., et al. 2000, ApJ, 533, 682 [NASA ADS] [CrossRef] [Google Scholar]
- Carnall, A. C., McLure, R. J., Dunlop, J. S., & Davé, R. 2018, MNRAS, 480, 4379 [Google Scholar]
- Carnall, A. C., McLure, R. J., Dunlop, J. S., et al. 2023, Nature, 619, 716 [NASA ADS] [CrossRef] [Google Scholar]
- Carnall, A. C., Cullen, F., McLure, R. J., et al. 2024, MNRAS, 534, 325 [NASA ADS] [CrossRef] [Google Scholar]
- Carniani, S., D’Eugenio, F., Ji, X., et al. 2025, A&A, 696, A87 [NASA ADS] [CrossRef] [EDP Sciences] [Google Scholar]
- Casey, C. M., Narayanan, D., & Cooray, A. 2014, Phys. Rep., 541, 45 [Google Scholar]
- Castellano, M., Napolitano, L., Fontana, A., et al. 2024, ApJ, 972, 143 [Google Scholar]
- Chabrier, G. 2003, PASP, 115, 763 [Google Scholar]
- Chittenden, H. G., Glazebrook, K., Nanayakkara, T., et al. 2025, arXiv e-prints [arXiv:2504.19696] [Google Scholar]
- Cochrane, R. K. 2025, MNRAS, 544, 1530 [Google Scholar]
- Conroy, C., & Gunn, J. E. 2010, ApJ, 712, 833 [Google Scholar]
- Conroy, C., Gunn, J. E., & White, M. 2009, ApJ, 699, 486 [Google Scholar]
- Covelo-Paz, A., Meuwly, C., Oesch, P. A., et al. 2026, A&A, 705, A155 [NASA ADS] [CrossRef] [EDP Sciences] [Google Scholar]
- Croton, D. J., Springel, V., White, S. D. M., et al. 2006, MNRAS, 365, 11 [Google Scholar]
- Curtis-Lake, E., Bluck, A., d’Eugenio, F., Maiolino, R., & Sijacki, D. 2023, Nat. Astron., 7, 247 [Google Scholar]
- Cutler, S. E., Whitaker, K. E., Weaver, J. R., et al. 2024, ApJ, 967, L23 [NASA ADS] [CrossRef] [Google Scholar]
- de Graaff, A., Brammer, G., Weibel, A., et al. 2025a, A&A, 697, A189 [NASA ADS] [CrossRef] [EDP Sciences] [Google Scholar]
- de Graaff, A., Setton, D. J., Brammer, G., et al. 2025b, Nat. Astron., 9, 280 [Google Scholar]
- Dome, T., Tacchella, S., Fialkov, A., et al. 2024, MNRAS, 527, 2139 [Google Scholar]
- Donnan, C. T., McLure, R. J., Dunlop, J. S., et al. 2024, MNRAS, 533, 3222 [NASA ADS] [CrossRef] [Google Scholar]
- Dressler, A. 1980, ApJ, 236, 351 [Google Scholar]
- Eisenstein, D. J., Willott, C., Alberts, S., et al. 2023, arXiv e-prints [arXiv:2306.02465] [Google Scholar]
- Endsley, R., Stark, D. P., Whitler, L., et al. 2024, MNRAS, 533, 1111 [NASA ADS] [CrossRef] [Google Scholar]
- Endsley, R., Chisholm, J., Stark, D. P., Topping, M. W., & Whitler, L. 2025, ApJ, 987, 189 [Google Scholar]
- Fabian, A. C. 2012, ARA&A, 50, 455 [Google Scholar]
- Franx, M., van Dokkum, P. G., Förster Schreiber, N. M., et al. 2008, ApJ, 688, 770 [NASA ADS] [CrossRef] [Google Scholar]
- Fudamoto, Y., Helton, J. M., Lin, X., et al. 2025, arXiv e-prints [arXiv:2503.15597] [Google Scholar]
- Gallazzi, A., Bell, E. F., Zibetti, S., Brinchmann, J., & Kelson, D. D. 2014, ApJ, 788, 72 [Google Scholar]
- Gelli, V., Pallottini, A., Salvadori, S., et al. 2025, ApJ, 985, 126 [Google Scholar]
- Genin, A., Shuntov, M., Brammer, G., et al. 2025, A&A, 699, A343 [NASA ADS] [CrossRef] [EDP Sciences] [Google Scholar]
- Glazebrook, K., Schreiber, C., Labbé, I., et al. 2017, Nature, 544, 71 [Google Scholar]
- Glazebrook, K., Nanayakkara, T., Schreiber, C., et al. 2024, Nature, 628, 277 [NASA ADS] [CrossRef] [Google Scholar]
- Gottumukkala, R., Barrufet, L., Oesch, P. A., et al. 2024, MNRAS, 530, 966 [NASA ADS] [CrossRef] [Google Scholar]
- Grogin, N. A., Kocevski, D. D., Faber, S. M., et al. 2011, ApJS, 197, 35 [NASA ADS] [CrossRef] [Google Scholar]
- Hamadouche, M. L., McLure, R. J., Carnall, A. C., et al. 2025, MNRAS, 541, 463 [Google Scholar]
- Harris, C. R., Millman, K. J., van der Walt, S. J., et al. 2020, Nature, 585, 357 [NASA ADS] [CrossRef] [Google Scholar]
- Heintz, K. E., Brammer, G. B., Watson, D., et al. 2025, A&A, 693, A60 [Google Scholar]
- Helton, J. M., Sun, F., Woodrum, C., et al. 2024a, ApJ, 962, 124 [NASA ADS] [CrossRef] [Google Scholar]
- Helton, J. M., Sun, F., Woodrum, C., et al. 2024b, ApJ, 974, 41 [Google Scholar]
- Hunter, J. D. 2007, Comput. Sci. Eng., 9, 90 [NASA ADS] [CrossRef] [Google Scholar]
- Ito, K., Valentino, F., Brammer, G., et al. 2024, ApJ, 964, 192 [CrossRef] [Google Scholar]
- Ito, K., Valentino, F., Brammer, G., et al. 2025a, A&A submitted, [arXiv:2506.22642] [Google Scholar]
- Ito, K., Valentino, F., Farcy, M., et al. 2025b, A&A, 697, A111 [Google Scholar]
- Jespersen, C. K., Carnall, A. C., & Lovell, C. C. 2025, ApJ, 988, L19 [Google Scholar]
- Johnson, B. D., Leja, J., Conroy, C., & Speagle, J. S. 2021, ApJS, 254, 22 [NASA ADS] [CrossRef] [Google Scholar]
- Kakimoto, T., Tanaka, M., Onodera, M., et al. 2024, ApJ, 963, 49 [NASA ADS] [CrossRef] [Google Scholar]
- Kawinwanichakij, L., Papovich, C., Quadri, R. F., et al. 2017, ApJ, 847, 134 [NASA ADS] [CrossRef] [Google Scholar]
- Kawinwanichakij, L., Glazebrook, K., Nanayakkara, T., et al. 2025, arXiv e-prints [arXiv:2505.03089] [Google Scholar]
- Kennicutt, R. C., Jr 1998, ARA&A, 36, 189 [NASA ADS] [CrossRef] [Google Scholar]
- Kennicutt, R. C., & Evans, N. J. 2012, ARA&A, 50, 531 [NASA ADS] [CrossRef] [Google Scholar]
- Koekemoer, A. M., Faber, S. M., Ferguson, H. C., et al. 2011, ApJS, 197, 36 [NASA ADS] [CrossRef] [Google Scholar]
- Kokorev, V., Chávez Ortiz, Ó. A., Taylor, A. J., et al. 2025, ApJ, 988, L10 [Google Scholar]
- Kron, R. G. 1980, ApJS, 43, 305 [Google Scholar]
- Langeroodi, D. 2024, arXiv e-prints [arXiv:2404.13045] [Google Scholar]
- Laporte, N., Zitrin, A., Dole, H., et al. 2022, A&A, 667, L3 [NASA ADS] [CrossRef] [EDP Sciences] [Google Scholar]
- Leja, J., Carnall, A. C., Johnson, B. D., Conroy, C., & Speagle, J. S. 2019a, ApJ, 876, 3 [Google Scholar]
- Leja, J., Johnson, B. D., Conroy, C., et al. 2019b, ApJ, 877, 140 [NASA ADS] [CrossRef] [Google Scholar]
- Leśniewska, A., Hjorth, J., & Gall, C. 2025, A&A, 699, A352 [NASA ADS] [CrossRef] [EDP Sciences] [Google Scholar]
- Looser, T. J., D’Eugenio, F., Maiolino, R., et al. 2024, Nature, 629, 53 [Google Scholar]
- Looser, T. J., D’Eugenio, F., Maiolino, R., et al. 2025, A&A, 697, A88 [NASA ADS] [CrossRef] [EDP Sciences] [Google Scholar]
- Man, A., & Belli, S. 2018, Nat. Astron., 2, 695 [NASA ADS] [CrossRef] [Google Scholar]
- McConachie, I., Wilson, G., Forrest, B., et al. 2022, ApJ, 926, 37 [NASA ADS] [CrossRef] [Google Scholar]
- McConachie, I., de Graaff, A., Maseda, M. V., et al. 2025, arXiv e-prints [arXiv:2510.25024] [Google Scholar]
- Moore, B., Katz, N., Lake, G., Dressler, A., & Oemler, A. 1996, Nature, 379, 613 [Google Scholar]
- Morishita, T., Liu, Z., Stiavelli, M., et al. 2025, ApJ, 982, 153 [Google Scholar]
- Naidu, R. P., Oesch, P. A., Brammer, G., et al. 2025, arXiv e-prints [arXiv:2505.11263] [Google Scholar]
- Nanayakkara, T., Glazebrook, K., Schreiber, C., et al. 2025, ApJ, 981, 78 [Google Scholar]
- Overzier, R. A. 2016, A&A Rev., 24, 14 [NASA ADS] [CrossRef] [Google Scholar]
- Pasha, I., & Miller, T. B. 2023, J. Open Source Software, 8, 5703 [Google Scholar]
- Peng, Y.-J., Lilly, S. J., Kovač, K., et al. 2010, ApJ, 721, 193 [Google Scholar]
- Planck Collaboration VI. 2020, A&A, 641, A6 [NASA ADS] [CrossRef] [EDP Sciences] [Google Scholar]
- Pollock, C. L., Gottumukkala, R., Heintz, K. E., et al. 2025, A&A submitted, [arXiv:2506.15779] [Google Scholar]
- Puskás, D., Tacchella, S., Simmonds, C., et al. 2025, MNRAS, 540, 2146 [Google Scholar]
- Rieke, M. J., Robertson, B., Tacchella, S., et al. 2023, ApJS, 269, 16 [NASA ADS] [CrossRef] [Google Scholar]
- Roberts-Borsani, G., Treu, T., Shapley, A., et al. 2024, ApJ, 976, 193 [NASA ADS] [CrossRef] [Google Scholar]
- Sandles, L., D’Eugenio, F., Helton, J. M., et al. 2023, arXiv e-prints [arXiv:2307.08633] [Google Scholar]
- Sato, R. A., Inoue, A. K., Harikane, Y., et al. 2024, MNRAS, 534, 3552 [Google Scholar]
- Sawicki, M., & Yee, H. K. C. 1998, AJ, 115, 1329 [NASA ADS] [CrossRef] [Google Scholar]
- Saxena, A., Cameron, A. J., Katz, H., et al. 2024, arXiv e-prints [arXiv:2411.14532] [Google Scholar]
- Schreiber, C., Pannella, M., Elbaz, D., et al. 2015, A&A, 575, A74 [NASA ADS] [CrossRef] [EDP Sciences] [Google Scholar]
- Sersic, J. L. 1968, Atlas de Galaxias Australes (Cordoba, Argentina: Observatorio Astronomico) [Google Scholar]
- Simmonds, C., Tacchella, S., Curtis-Lake, W. M. E., et al. 2025, MNRAS, 544, 4551 [Google Scholar]
- Speagle, J. S. 2020, MNRAS, 493, 3132 [Google Scholar]
- Stevenson, S. D., Carnall, A. C., Leung, H. H., et al. 2026, MNRAS, 545, staf2087 [Google Scholar]
- Strait, V., Brammer, G., Muzzin, A., et al. 2023, ApJ, 949, L23 [NASA ADS] [CrossRef] [Google Scholar]
- Tacchella, S., Carollo, C. M., Renzini, A., et al. 2015, Science, 348, 314 [NASA ADS] [CrossRef] [Google Scholar]
- Tacchella, S., Finkelstein, S. L., Bagley, M., et al. 2022, ApJ, 927, 170 [NASA ADS] [CrossRef] [Google Scholar]
- Tanaka, M., Onodera, M., Shimakawa, R., et al. 2024, ApJ, 970, 59 [Google Scholar]
- Taylor, M. B. 2005, in Astronomical Data Analysis Software and Systems XIV, eds. P. Shopbell, M. Britton, & R. Ebert, ASP Conf. Ser., 347, 29 [Google Scholar]
- Trussler, J. A. A., Conselice, C. J., Adams, N., et al. 2025, MNRAS, 537, 3662 [Google Scholar]
- Valentino, F., Tanaka, M., Davidzon, I., et al. 2020, ApJ, 889, 93 [Google Scholar]
- Valentino, F., Brammer, G., Gould, K. M. L., et al. 2023, ApJ, 947, 20 [NASA ADS] [CrossRef] [Google Scholar]
- Valentino, F., Heintz, K. E., Brammer, G., et al. 2025, A&A, 699, A358 [NASA ADS] [CrossRef] [EDP Sciences] [Google Scholar]
- van Dokkum, P. G., Bezanson, R., van der Wel, A., et al. 2014, ApJ, 791, 45 [NASA ADS] [CrossRef] [Google Scholar]
- Vogelsberger, M., Marinacci, F., Torrey, P., & Puchwein, E. 2020, Nat. Rev. Phys., 2, 42 [Google Scholar]
- Weibel, A., de Graaff, A., Setton, D. J., et al. 2025, ApJ, 983, 11 [Google Scholar]
- White, S. D. M., & Rees, M. J. 1978, MNRAS, 183, 341 [Google Scholar]
- Wilkins, S. M., Bunker, A. J., Stanway, E., Lorenzoni, S., & Caruana, J. 2011, MNRAS, 417, 717 [NASA ADS] [CrossRef] [Google Scholar]
- Wilkins, S. M., Lovell, C. C., & Stanway, E. R. 2019, MNRAS, 490, 5359 [NASA ADS] [CrossRef] [Google Scholar]
- Witten, C., McClymont, W., Laporte, N., et al. 2025a, MNRAS, 537, 112 [Google Scholar]
- Witten, C., Oesch, P. A., Bennett, J. S., et al. 2025b, A&A submitted, [arXiv:2511.05647] [Google Scholar]
- Witten, C., Oesch, P. A., McClymont, W., et al. 2025c, arXiv e-prints [arXiv:2507.06284] [Google Scholar]
- Wu, P.-F. 2025, ApJ, 978, 131 [Google Scholar]
- Zavala, J. A., Montaña, A., Hughes, D. H., et al. 2018, Nat. Astron., 2, 56 [Google Scholar]
- Zhang, Y., de Graaff, A., Setton, D. J., et al. 2025, arXiv e-prints [arXiv:2508.08577] [Google Scholar]
- Zinger, E., Pillepich, A., Nelson, D., et al. 2020, MNRAS, 499, 768 [CrossRef] [Google Scholar]
As an example, one cannot quench a z = 7 galaxy in 1 Gyr due to the age of the Universe at that redshift only giving a absolute maximum of ∼700 Myr.
It should be noted that these UVJ colours are computed from the EAZY best-fit model to photometry rather than the spectrum. The UVJ colours obtained by the full spectrophotometric fitting is consistent with that of the EAZY colours to around 1σ. The full spectrophotometric fitting finds that both galaxies are slightly bluer in the V − J colours.
We note that the stellar masses of GS-z5-Q1 and COS-z5-Q1 differ by around 0.2dex compared to that measured using photometry by Baker et al. (2025d), but caution that that is fully consistent with the different SFHs and fitting codes used between these two (e.g. Leja et al. 2019a).
For example, the possible role of mergers in quenching high-z galaxies is still poorly understood, with simulations predicting a majority of in-situ mass-build-up within massive quiescent galaxies (Baker et al. 2025b) and suggesting merging activity is negligible (Chittenden et al. 2025). However, these simulations quickly run into resolution issues so the role of lower mass minor mergers remains unclear.
Therefore it is difficult to determine if the mini-quenched galaxies host any older stellar populations (Baker et al. 2025a; Witten et al. 2025a).
However, it should be noted that if the Looser et al. (2024) mini-quenched galaxy were to remain completely dormant and turn into a 108.7 M⊙ quiescent galaxy, it would develop a much stronger Balmer break and redder UV slope (stronger than COS-z5-Q1, which is consistent with COS-z5-Q1 having a more recent SFH). The issue here is that it would be so faint as to be undetectable within any reasonable integration time with the NIRSpec instrument. This highlights one reason why we have not found z ∼ 5, M∗ ≈ 108.5 M⊙ quiescent galaxies. Therefore, we did not probe this purely ageing scenario, rather the possibility that the Looser et al. (2024) galaxy could turn into a quiescent galaxy with the mass of COS-z5-Q1. It is worth noting that this could open up the possibility of finding M* ≈ 109.5 M⊙ mini-quenched galaxies at high z.
All Tables
All Figures
|
Fig. 1. Left: UVJ colour diagram. GS-z5-Q1 and COS-z5-Q1 are indicated with full red circles, along with the sources in Weibel et al. (2025), Looser et al. (2024), de Graaff et al. (2025b) as labelled. The background grey-scaled sources are QG candidates at z > 2 from Baker et al. (2025d), where the mass cut has been relaxed (M★ > 109.3 M⊙). Right: Same galaxies as on the left are shown in the stellar mass versus redshift plane. Quiescent galaxies with JWST medium/high-resolution spectra compiled in Ito et al. (2025a) are also shown in squares. It highlights how low-mass GS-z5-Q1 and COS-z5-Q1 are compared to the de Graaff et al. (2025b) galaxy at z = 4.9, i.e. almost 1.5 dex less massive, despite having similar colours and redshifts. |
| In the text | |
|
Fig. 2. Top: Observed 1D NIRSpec prism spectra (grey), photometry (yellow points) and best-fit model spectra and photometry (red) for GS-z5-Q1 (left) and COS-z5-Q1 (right). The MIRI points are shown in the right extension to the figure and correspond to F560W (just GS-z5-Q1) and F770W (both). Bottom-middle: χ values for the spectral fit with the NIRCam filters overplotted (left) and an RGB image of the galaxy (right). Notable emission lines are overplotted. Bottom: SFHs for the two galaxies (orange line) showing SFR against lookback time (redshift). The formation time (t50, the time 50% of the mass is formed) and quenching time (t90, the time 90% of the mass is formed) and overplotted as blue and red lines, respectively. |
| In the text | |
|
Fig. 3. Sérsic modeling of the surface brightness in NIRCam/F277W of COS-z5-Q1 (top) and GS-z5-Q1 (bottom). In each row, the first panel shows the image in pixel units (3″ side, |
| In the text | |
|
Fig. 4. Distribution of galaxies around the GS-z5-Q1 (left) and COS-z5-Q1 (right). These QGs are located in the centre of the field and marked as stars. The coloured circles and smaller black circles correspond to galaxies at 5.26 < z < 5.52 (for GS-z5-Q1) and 4.99 < z < 5.23 (for COS-z5-Q1) according to their spectroscopic and photometric redshift, respectively. The contours show the overdensity measured from photometric and spectroscopic galaxies. The number in these contours indicates the significance of the overdensity. For GS-z5-Q1, the location of the overdensity centre reported in Helton et al. (2024a) is shown as a green square. |
| In the text | |
|
Fig. 5. Comparison between GS-z5-Q1, COS-z5-Q1, and three sources from the literature. These are a low-mass ‘mini-quenched’ galaxy from Looser et al. (2024), a massive quiescent galaxy at z = 4.9 from de Graaff et al. (2025b) and the current highest-redshift massive quiescent galaxy spectrum from Weibel et al. (2025). The spectra have been rebinned and renormalised to deal better with noise and improve clarity. It shows that GS-z5-Q1 and COS-z5-Q1 are consistent with the spectral shapes of the Weibel et al. (2025) and de Graaff et al. (2025b) spectra, but are completely different to the classic Looser et al. (2024) ‘mini-quenched’ galaxy spectrum. GS-z5-Q1 and COS-z5-Q1 have red UV slopes and more prominent Balmer breaks whereas the Looser et al. (2024) galaxy has a much steeper UV slope and significantly weaker Balmer break. |
| In the text | |
|
Fig. 6. Left: z = 7.3 Looser et al. (2024) mini-quenched galaxy spectrum with an appropriate same redshift FSPS model overplotted (red). Right: COS-z5-Q1 observed spectrum with the same FSPS model, only with the addition of a burst and with stellar population aged from z = 7.3 to z = 5.1. It shows that it is possible to the evolution of a mini-quenched galaxy into a low-mass quiescent galaxy with minimal assumptions. |
| In the text | |
Current usage metrics show cumulative count of Article Views (full-text article views including HTML views, PDF and ePub downloads, according to the available data) and Abstracts Views on Vision4Press platform.
Data correspond to usage on the plateform after 2015. The current usage metrics is available 48-96 hours after online publication and is updated daily on week days.
Initial download of the metrics may take a while.