Fig. 4.
Download original image
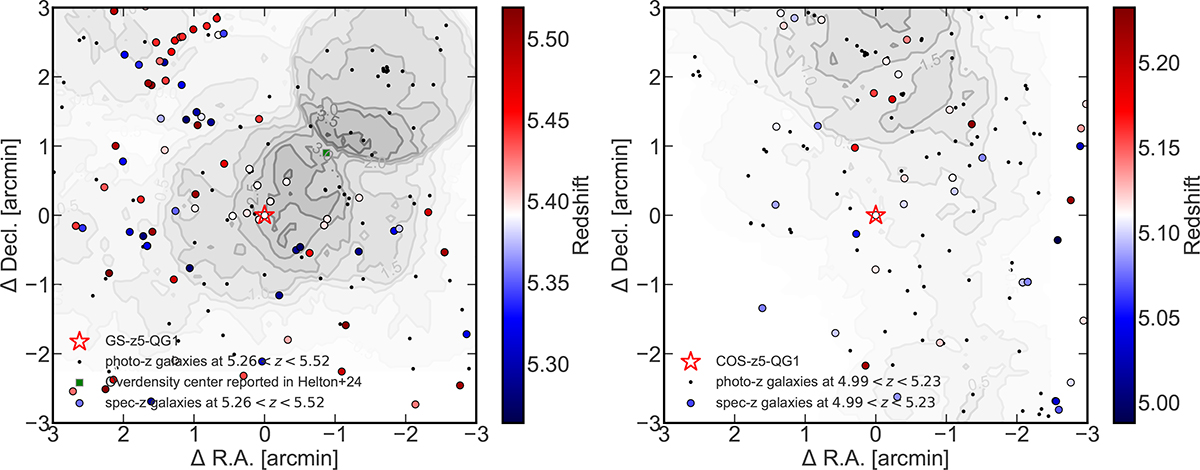
Distribution of galaxies around the GS-z5-Q1 (left) and COS-z5-Q1 (right). These QGs are located in the centre of the field and marked as stars. The coloured circles and smaller black circles correspond to galaxies at 5.26 < z < 5.52 (for GS-z5-Q1) and 4.99 < z < 5.23 (for COS-z5-Q1) according to their spectroscopic and photometric redshift, respectively. The contours show the overdensity measured from photometric and spectroscopic galaxies. The number in these contours indicates the significance of the overdensity. For GS-z5-Q1, the location of the overdensity centre reported in Helton et al. (2024a) is shown as a green square.
Current usage metrics show cumulative count of Article Views (full-text article views including HTML views, PDF and ePub downloads, according to the available data) and Abstracts Views on Vision4Press platform.
Data correspond to usage on the plateform after 2015. The current usage metrics is available 48-96 hours after online publication and is updated daily on week days.
Initial download of the metrics may take a while.