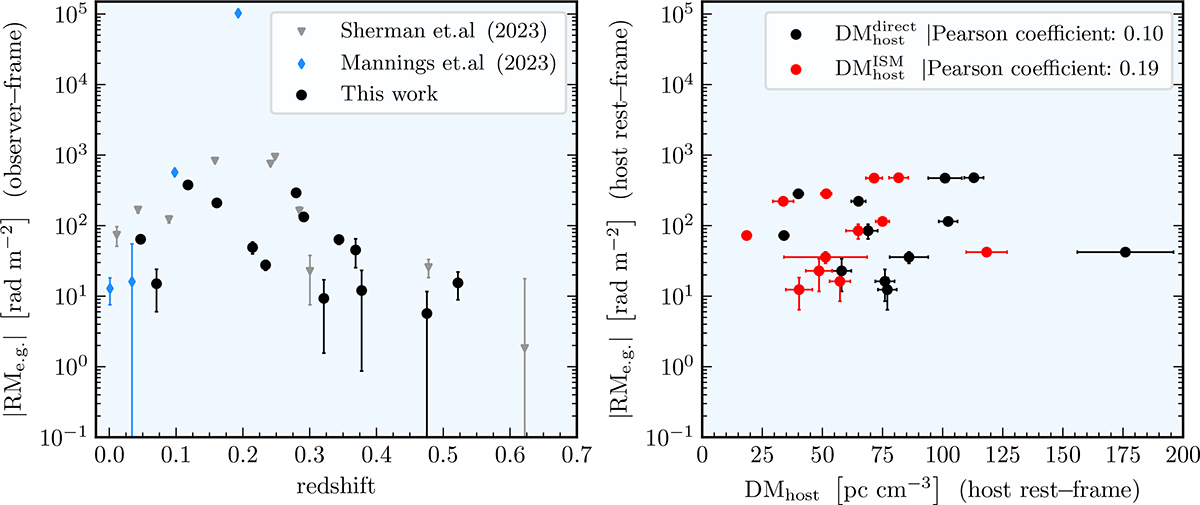
Fig. 1.
Download original image
Left: Distribution of absolute values of RMeg as a function of FRB redshift in observer frame. The black dots show the FRB sample analysed in this work, whereas the grey triangles are the DSA-110 subsample taken from Sherman et al. (2023) and the blue diamonds illustrate the FRBs from the Mannings et al. (2023) sample, which are not part of this work. Right: Distribution of RMeg values in rest-frame of FRB hosts as a function of the corresponding ![]() and
and ![]() values from Bernales-Cortes et al. (2025) (only for sources for which corresponding MUSE data are available).
values from Bernales-Cortes et al. (2025) (only for sources for which corresponding MUSE data are available).
Current usage metrics show cumulative count of Article Views (full-text article views including HTML views, PDF and ePub downloads, according to the available data) and Abstracts Views on Vision4Press platform.
Data correspond to usage on the plateform after 2015. The current usage metrics is available 48-96 hours after online publication and is updated daily on week days.
Initial download of the metrics may take a while.