Fig. 4.
Download original image
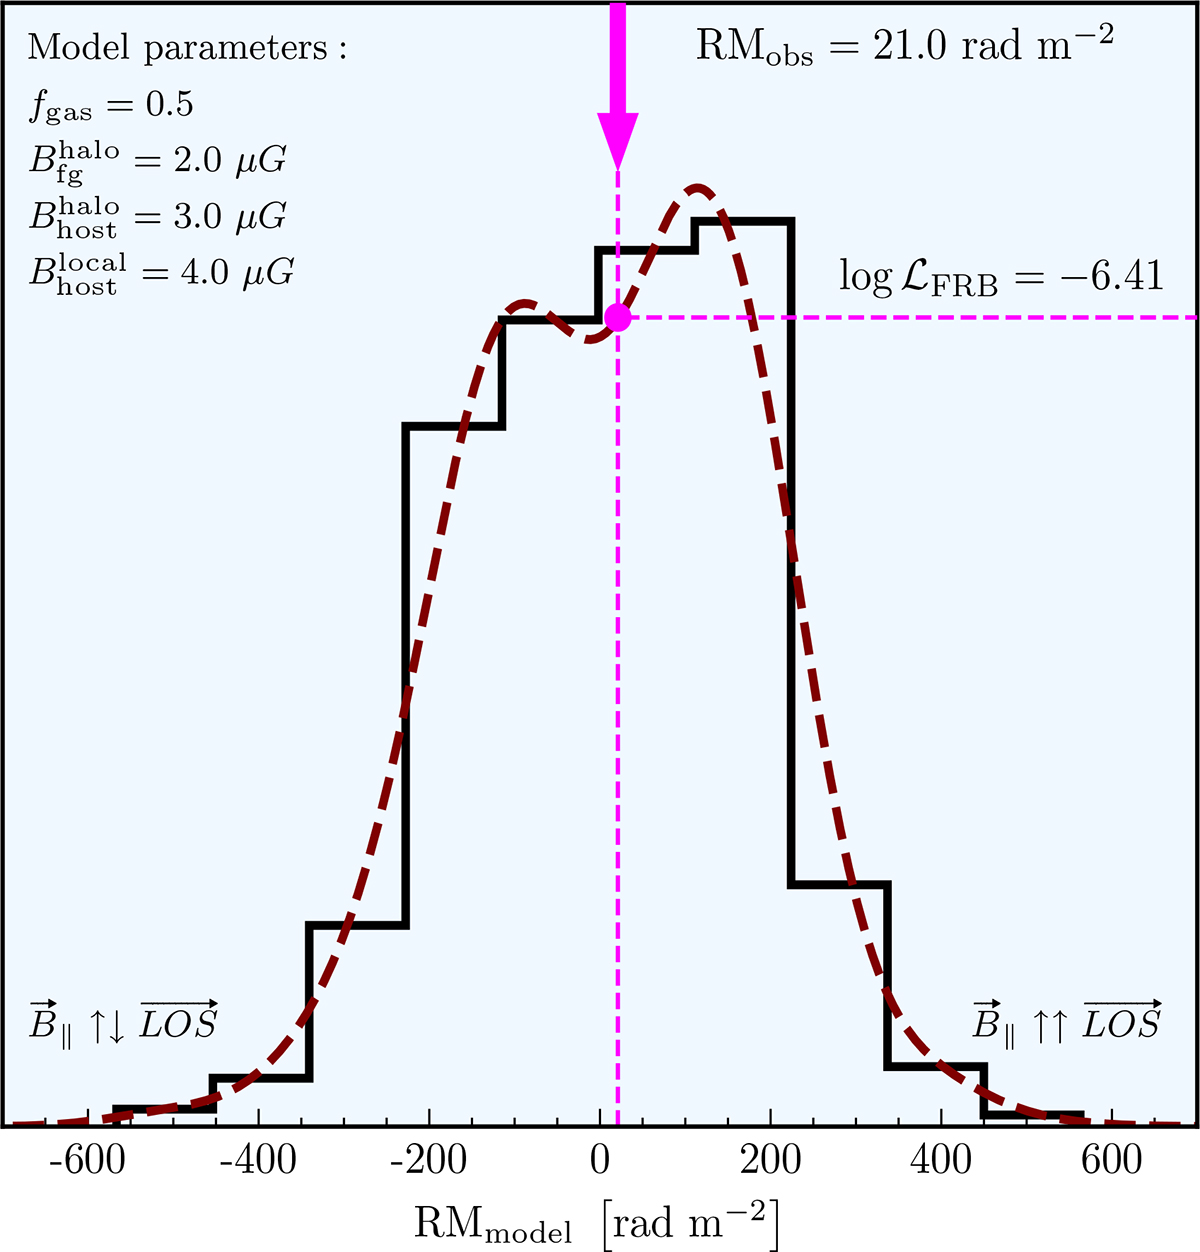
Resulting distribution of RMmodel values given by Eq. (3), estimated by combining contributions from each environment along the FRB sight line (see Section 3 and Figure 3 for details). The vertical dashed magenta line illustrates the value of the RMobs for FRB 20211212A, while the horizontal magenta dotted line shows the value of the corresponding log-likelihood value (logℒFRB = −6.41) evaluated from the KDE fit to the RMmodel distribution at the value of RMobs, given the combination of model parameters Θ (see discussion in Section 4 for more details).
Current usage metrics show cumulative count of Article Views (full-text article views including HTML views, PDF and ePub downloads, according to the available data) and Abstracts Views on Vision4Press platform.
Data correspond to usage on the plateform after 2015. The current usage metrics is available 48-96 hours after online publication and is updated daily on week days.
Initial download of the metrics may take a while.