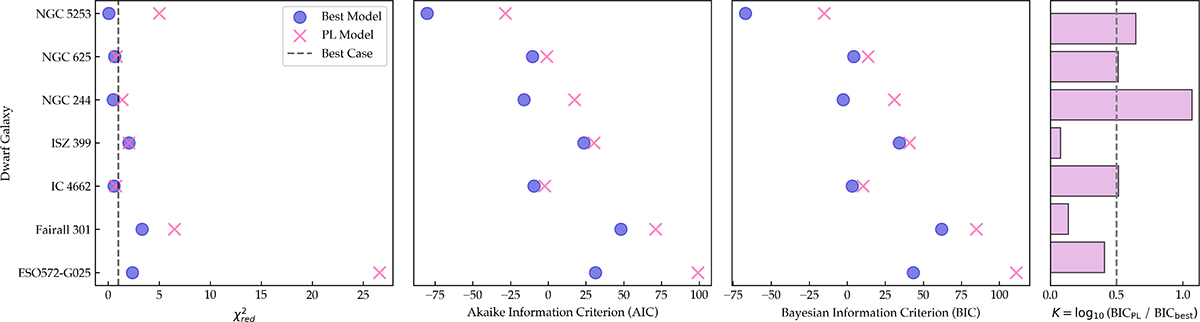
Fig. 10.
Download original image
Comparison between the best-fit model and the simple power-law (PL) model using statistical criteria: reduced chi-squared (χred2), Akaike Information Criterion (AIC), Bayesian Information Criterion (BIC), and Jeffreys’ scale (Kass & Raftery 1995). The black dotted line in the left panel marks the reference value of χred2 = 1, while the black dotted line in the right panel indicates the threshold where the the best-fit model are significantly preferred over the simple power-law.
Current usage metrics show cumulative count of Article Views (full-text article views including HTML views, PDF and ePub downloads, according to the available data) and Abstracts Views on Vision4Press platform.
Data correspond to usage on the plateform after 2015. The current usage metrics is available 48-96 hours after online publication and is updated daily on week days.
Initial download of the metrics may take a while.