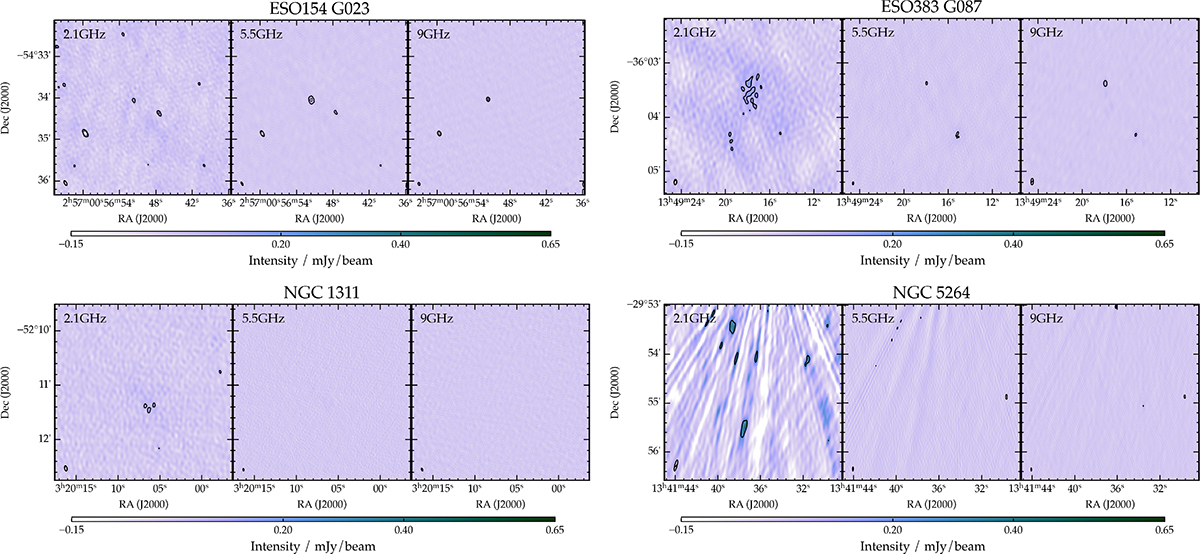
Fig. A.3.
Download original image
First row left panel: Total intensity emission of ESO 154 G 023 at the central frequency of 2.1 (σ = 40 μJy/beam), 5.5 (σ = 10 μJy/beam) and 9 GHz (σ = 12 μJy/beam) with overlaid contours starting at 3 σ and increasing by factor of two. First row right panel: Total intensity emission of ESO 383 G 087 at the central frequency of 2.1 (σ = 40 μJy/beam), 5.5 (σ = 15 μJy/beam) and 9 GHz (σ = 20 μJy/beam) with overlaid contours starting at 3 σ and increasing by factor of two. Second row left panel: Total intensity emission of NGC 1311 at the central frequency of 2.1 (σ = 27 μJy/beam), 5.5 (σ = 15 μJy/beam) and 9 GHz (σ = 10 μJy/beam) with overlaid contours starting at 3 σ and increasing by factor of two. Second row right panel: Total intensity emission of NGC 5264 at the central frequency of 2.1 (σ = 80 μJy/beam), 5.5 (σ = 20 μJy/beam) and 9 GHz (σ = 13 μJy/beam) with overlaid contours starting at 3 σ and increasing by factor of two. The beam is shown in the left corner.
Current usage metrics show cumulative count of Article Views (full-text article views including HTML views, PDF and ePub downloads, according to the available data) and Abstracts Views on Vision4Press platform.
Data correspond to usage on the plateform after 2015. The current usage metrics is available 48-96 hours after online publication and is updated daily on week days.
Initial download of the metrics may take a while.