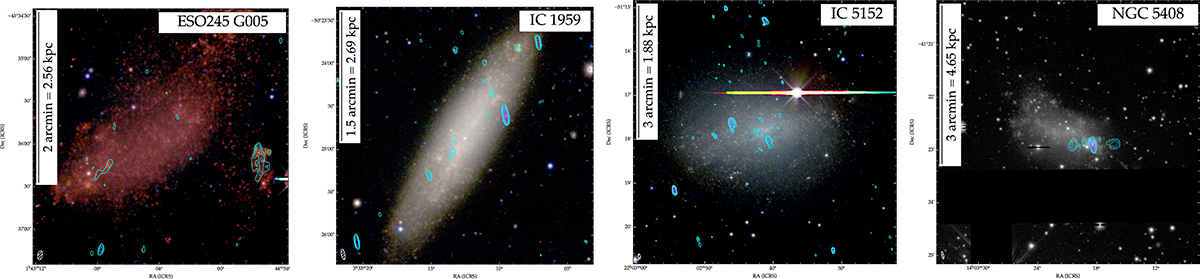
Fig. 2.
Download original image
Colour-composite images from the DESI Legacy Imaging Surveys of the RC non-detected CHILLING sample, showing more compact emission, with overlaid 2.1 GHz ATCA radio emission contours starting at 3σ and increasing by a factor of ![]() . The scale in the top left corner is calculated using the distance to the source. The beam is shown in the bottom left corner. The noise level σ2.1 GHz can be taken from Table 3.
. The scale in the top left corner is calculated using the distance to the source. The beam is shown in the bottom left corner. The noise level σ2.1 GHz can be taken from Table 3.
Current usage metrics show cumulative count of Article Views (full-text article views including HTML views, PDF and ePub downloads, according to the available data) and Abstracts Views on Vision4Press platform.
Data correspond to usage on the plateform after 2015. The current usage metrics is available 48-96 hours after online publication and is updated daily on week days.
Initial download of the metrics may take a while.