Fig. 5.
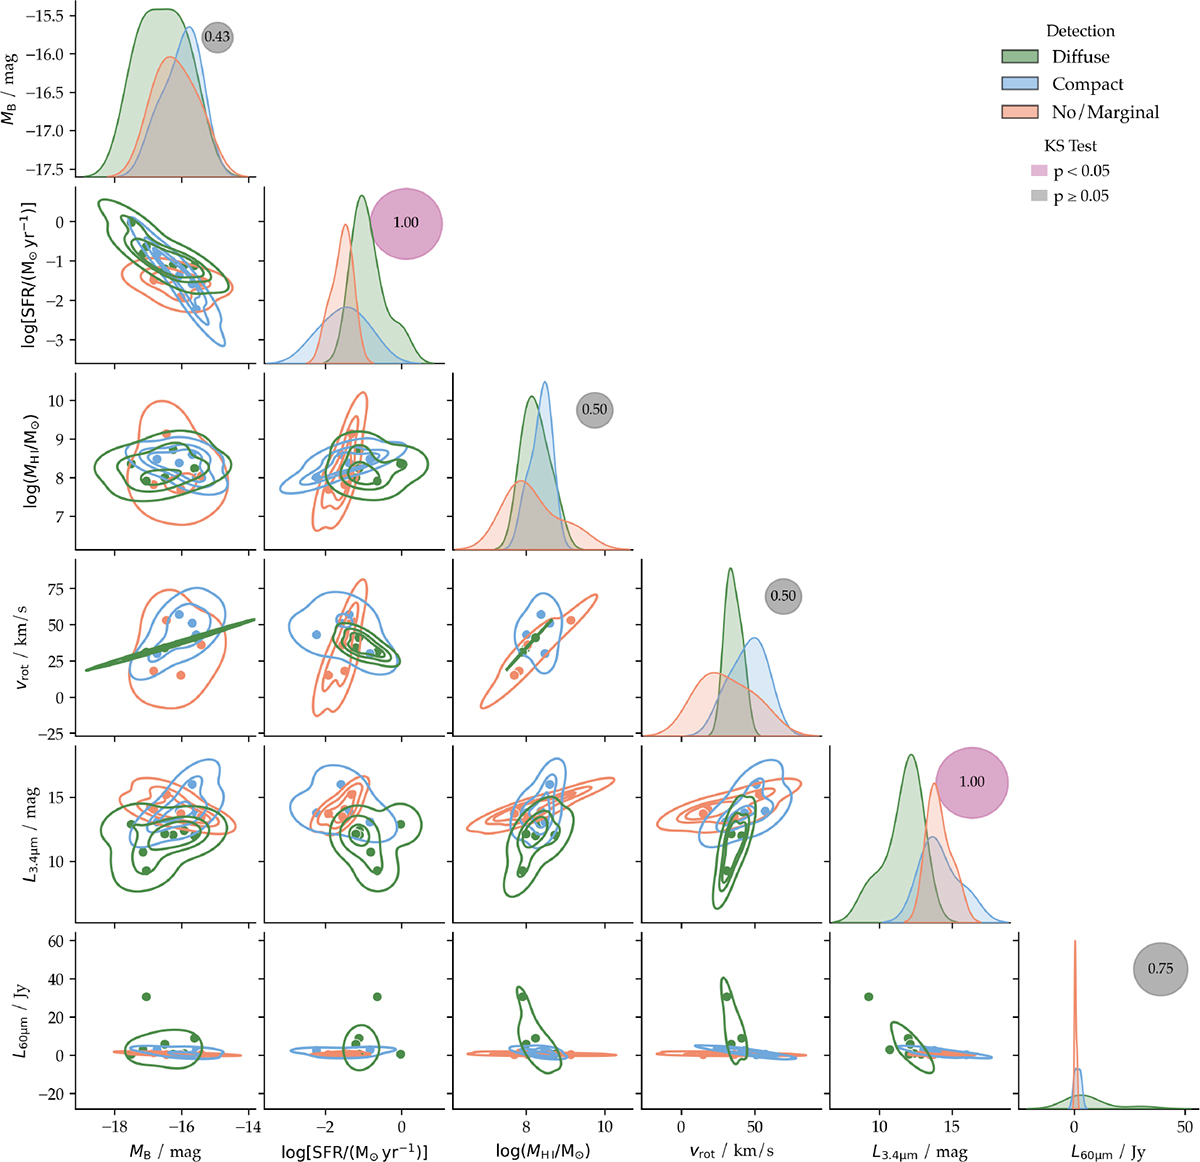
Download original image
Correlation analysis of several galaxy parameters with the dependence of RC emission detection. It represents different physical properties, including absolute magnitude in the B-band MB, star formation rate (SFR), HI mass MHI, maximum rotation velocity of the gas corrected for inclination (vrot), mid-infrared magnitude at 3.4 μm (L3.4 μm) from WISE and far-infrared (FIR) luminosity at 60 μm (L60 μm) from IRAS. Galaxies with diffuse RC emission are shown in green, those with compact emission in blue, and galaxies with no or very weak detection in orange. The Kolmogorov–Smirnov (KS) test results are visualised as circles on the diagonal of the plot, with sizes ranging from 0 to 1; larger circles indicate greater differences between the distributions. The exact value from the KS-test are shown inside the circles. The colour represents statistical significance based on the p-value: pink circles indicate significant differences (p < 0.05), while gray circles indicate non-significant results. The kernel density estimation contours in the lower triangle enclose roughly 25%, 50%, 75%, and 95% of the dwarf galaxies, highlighting regions of highest to lowest density in each variable pair.
Current usage metrics show cumulative count of Article Views (full-text article views including HTML views, PDF and ePub downloads, according to the available data) and Abstracts Views on Vision4Press platform.
Data correspond to usage on the plateform after 2015. The current usage metrics is available 48-96 hours after online publication and is updated daily on week days.
Initial download of the metrics may take a while.