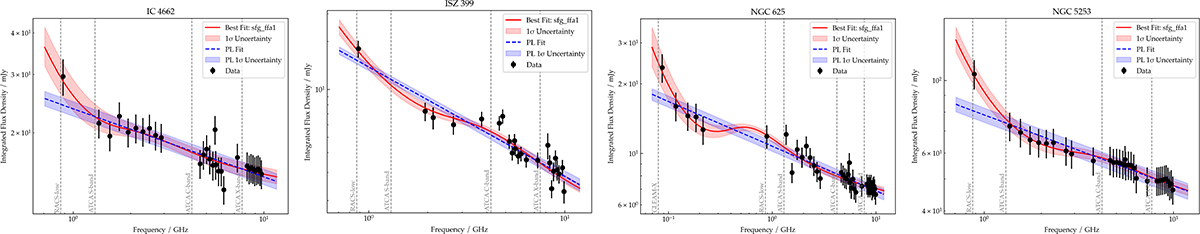
Fig. 6.
Download original image
SEDs of the diffuse RC-detected CHILLING sample, with the complex model SFG_FFA1 as best-fit, which combines thermal and non-thermal emission with external free–free absorption. The plot displays total intensity data with different observations: RACS-Low (Hale et al. 2021), our ATCA S-band, C-band and X-band, and GLEAM-X data (Ross et al. 2024) only for Fairall 301 and NGC 625. The frequency range of the telescope data is indicated by a grey dotted line. Additionally, we show the best-fit in red for each galaxy out of these 19 different models, explained in the Appendix B. The highlighted red regions represent the 1σ uncertainties sampled by EMCEE. For comparison to the best-fit, we show the simple power-law (PL) fit with its uncertainty range in a blue dotted line.
Current usage metrics show cumulative count of Article Views (full-text article views including HTML views, PDF and ePub downloads, according to the available data) and Abstracts Views on Vision4Press platform.
Data correspond to usage on the plateform after 2015. The current usage metrics is available 48-96 hours after online publication and is updated daily on week days.
Initial download of the metrics may take a while.