Open Access
Fig. 8.
Download original image
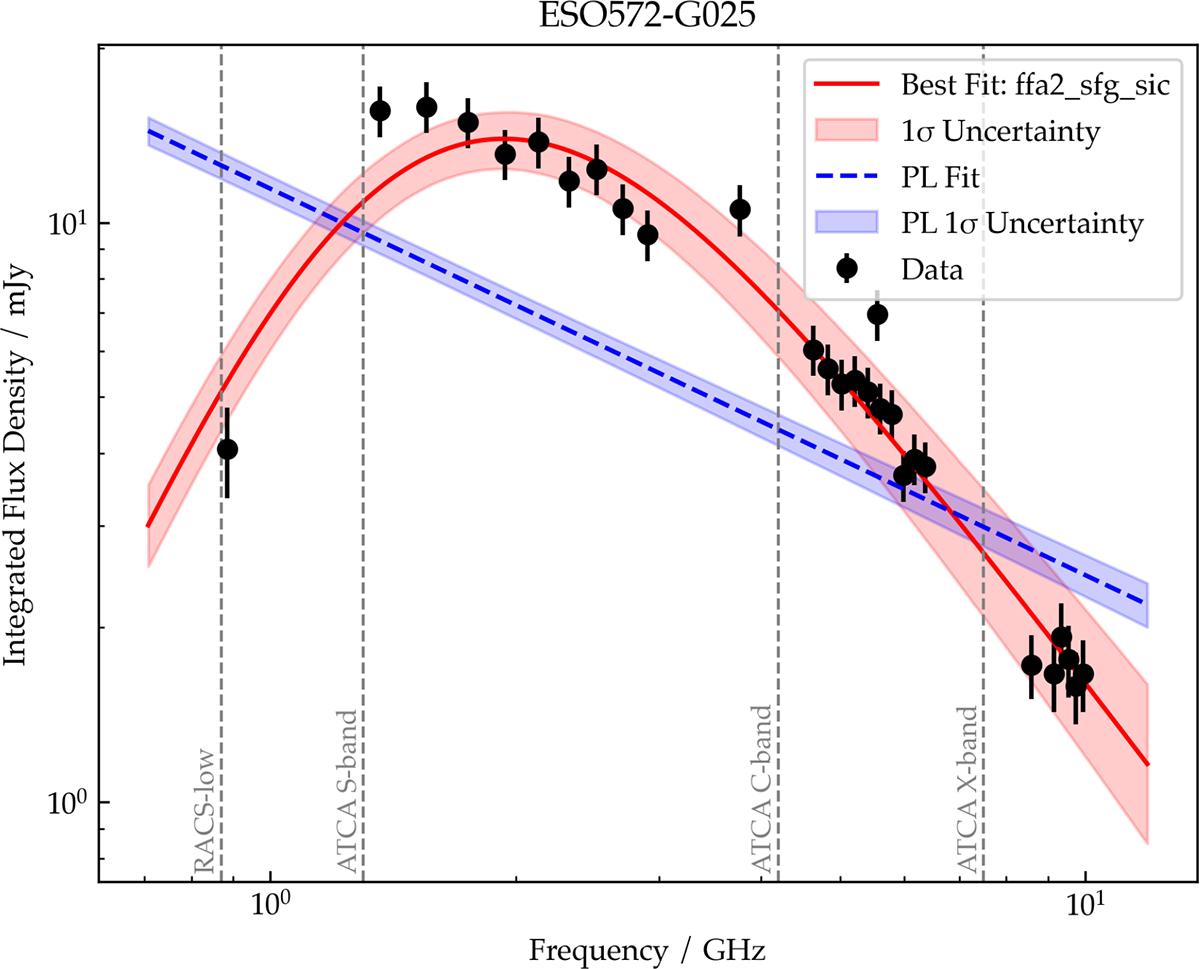
SED of the diffuse RC-detected CHILLING sample, with the complex model FFA2_SFG_SIC as best-fit, which includes internal free–free absorption at low frequencies, thermal and non-thermal emission, and energy losses at high frequencies. The explanation follows that given in Fig. 6.
Current usage metrics show cumulative count of Article Views (full-text article views including HTML views, PDF and ePub downloads, according to the available data) and Abstracts Views on Vision4Press platform.
Data correspond to usage on the plateform after 2015. The current usage metrics is available 48-96 hours after online publication and is updated daily on week days.
Initial download of the metrics may take a while.