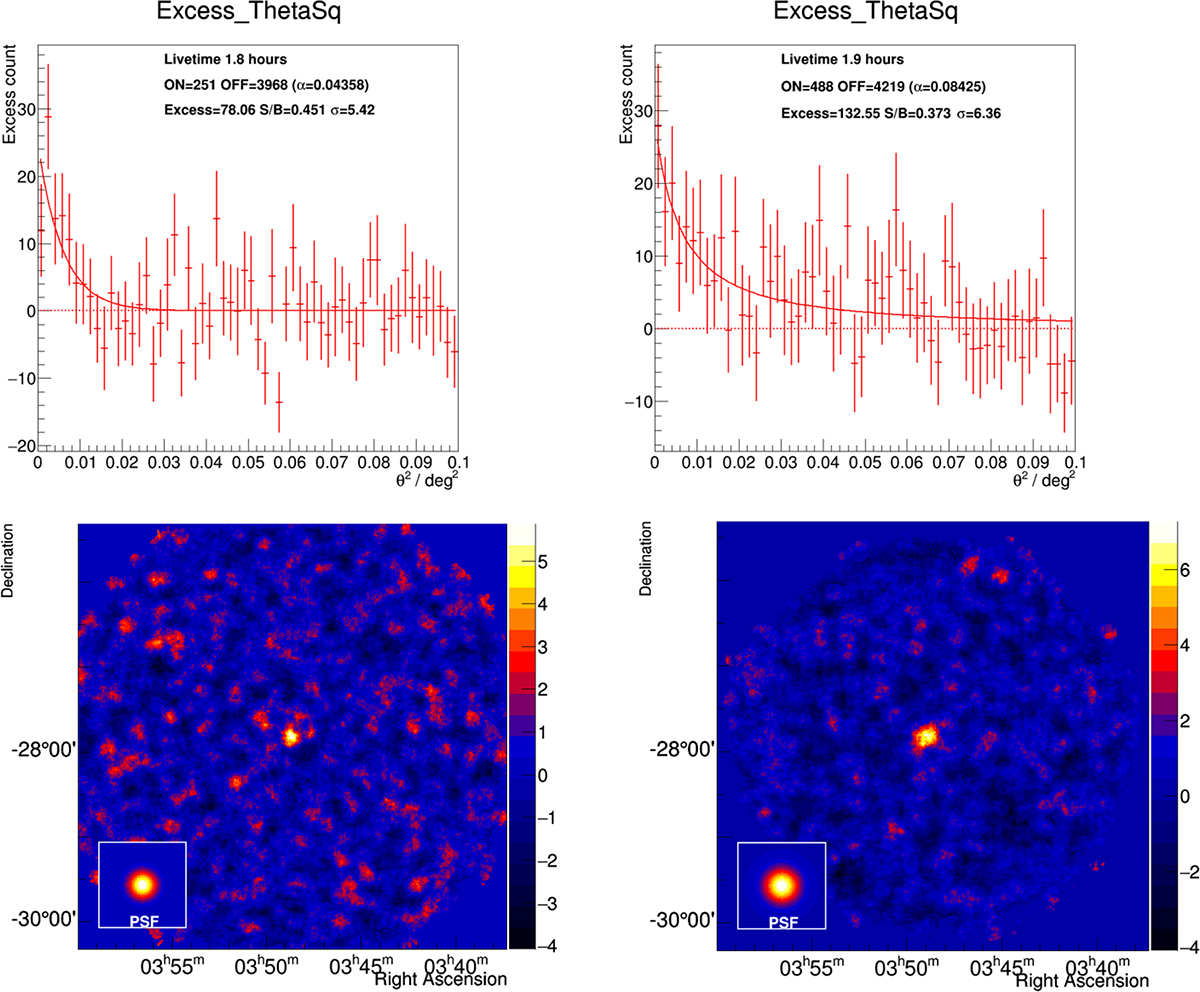
Fig. 1.
Download original image
Result for θ2 from the 3 November 2021 (MJD 59521.93 – 59521.99) observation night analysis and significance plots with the four selected runs. Top-left and bottom-left panels: Results from the CT1-4 dataset. Top-right and bottom-right panels: Results from the CT5 dataset. The inset shows the point spread function, which was derived by fitting the θ2 distribution to the KING’s function, described in Ackermann et al. (2013).
Current usage metrics show cumulative count of Article Views (full-text article views including HTML views, PDF and ePub downloads, according to the available data) and Abstracts Views on Vision4Press platform.
Data correspond to usage on the plateform after 2015. The current usage metrics is available 48-96 hours after online publication and is updated daily on week days.
Initial download of the metrics may take a while.