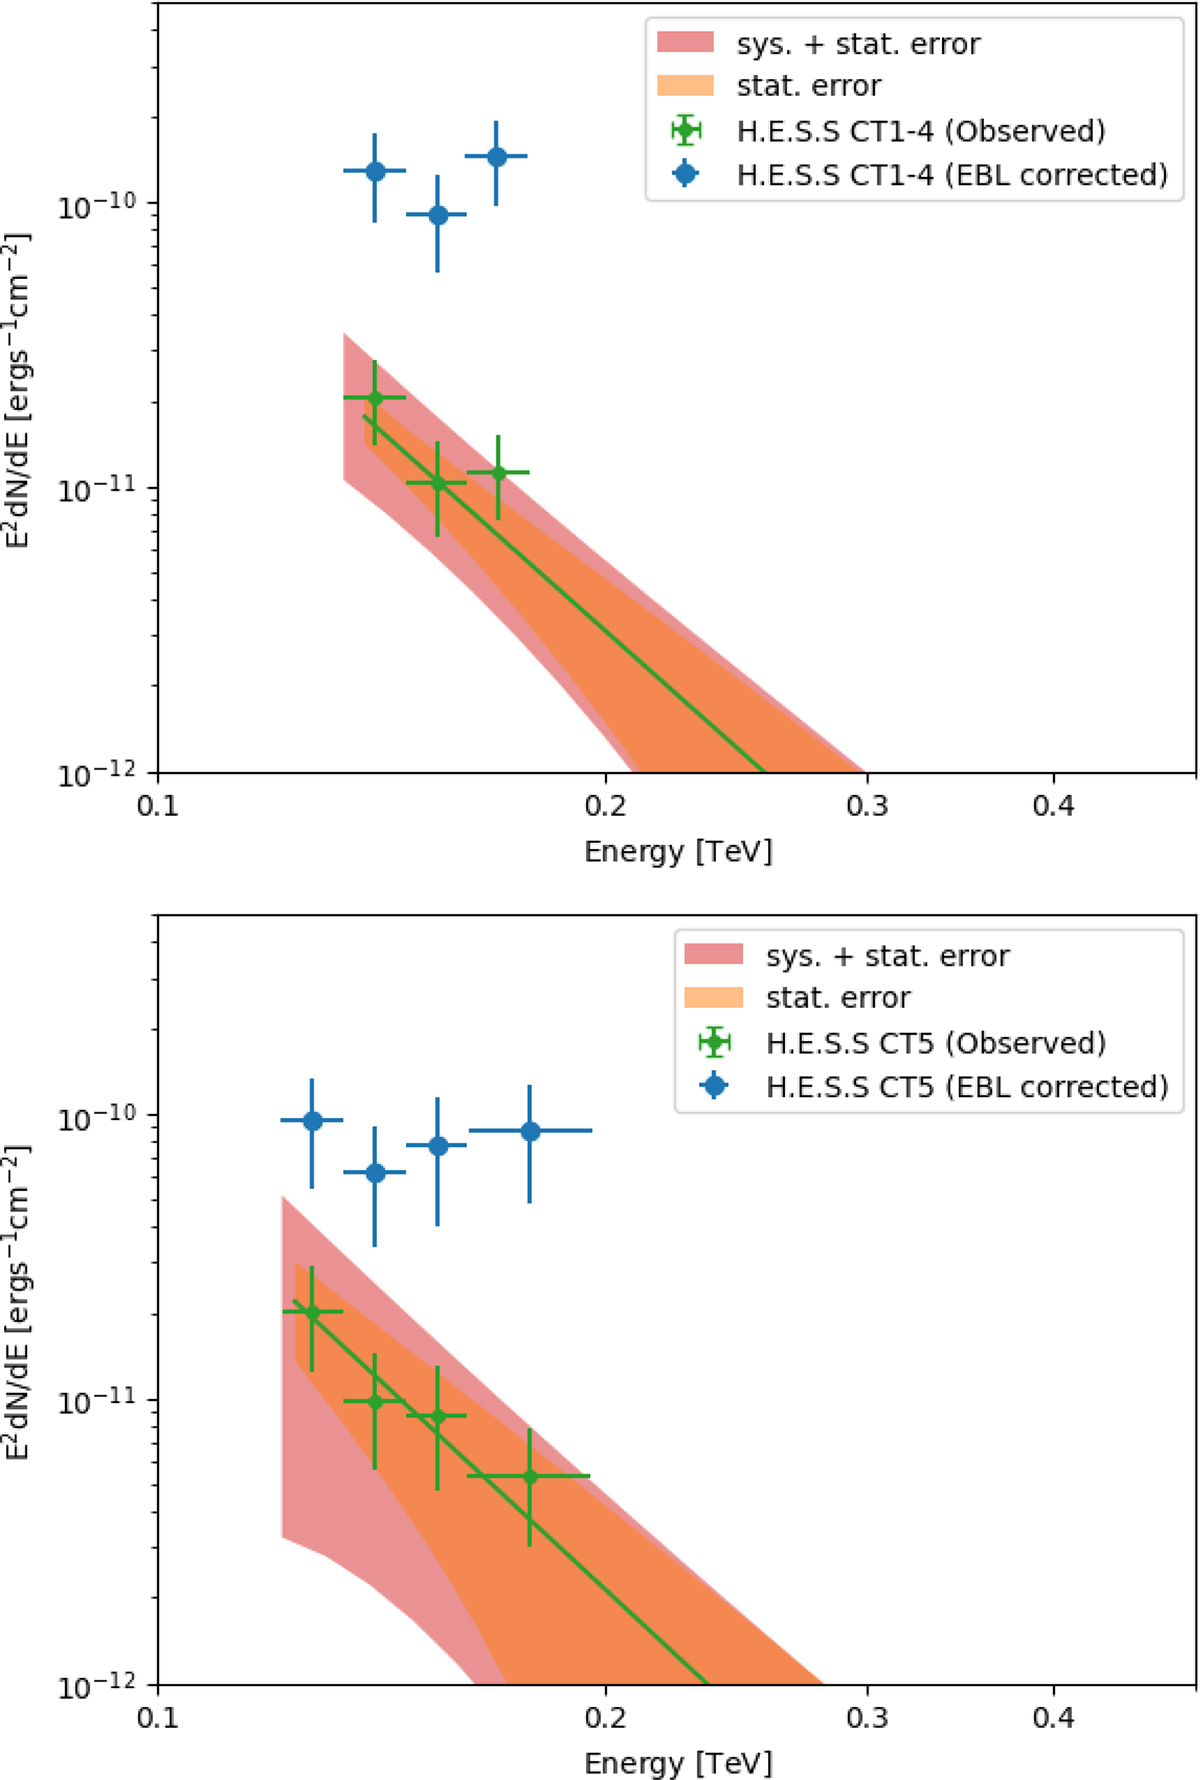
Fig. 2.
Download original image
Observed spectra and flux points together with intrinsic flux points for the CT1-4 (top panel) and CT5 (bottom panel) dataset. The observed spectrum and flux points were de-absorbed with the Finke et al. (2010) EBL model. The orange bands are the statistical errors only, while the purple bands show the systematic errors together with the statistical errors. The error bars of the flux points are statistical only.
Current usage metrics show cumulative count of Article Views (full-text article views including HTML views, PDF and ePub downloads, according to the available data) and Abstracts Views on Vision4Press platform.
Data correspond to usage on the plateform after 2015. The current usage metrics is available 48-96 hours after online publication and is updated daily on week days.
Initial download of the metrics may take a while.