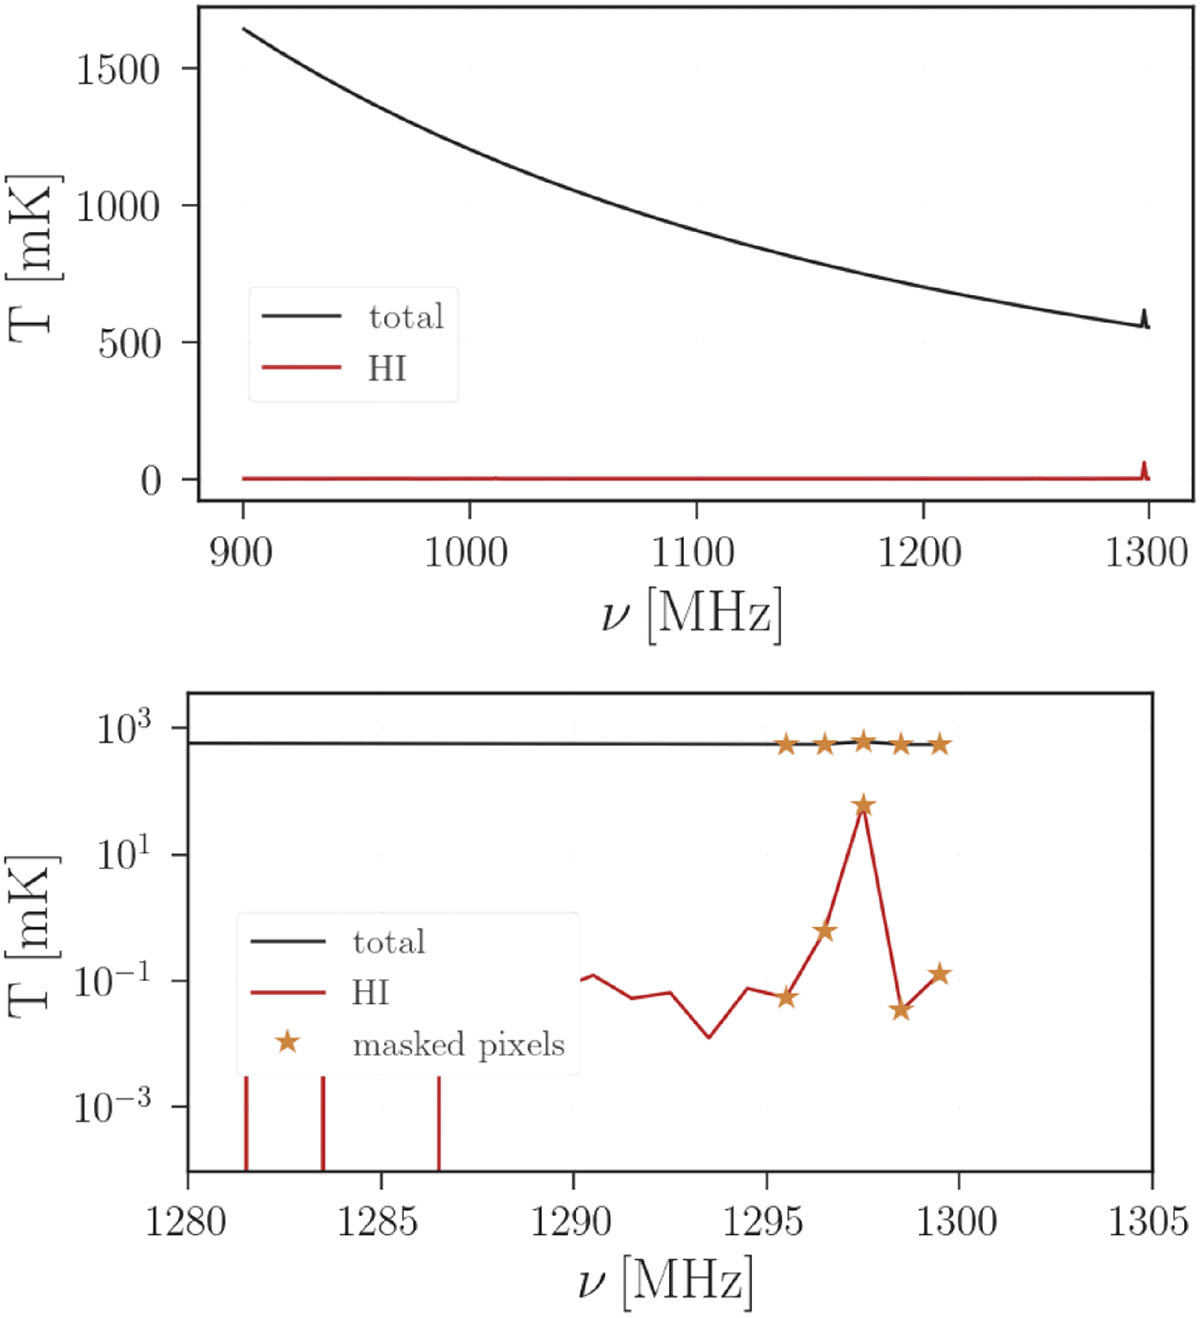
Fig. B.1.
Download original image
Temperature profile for a single line of sight. Top: Total observed brightness temperature T(ν) (black) and the underlying HI signal along the same LOS (red). Bottom: Zoom on the frequency range containing the prominent peak (note the logarithmic T scale). Star symbols mark the channels flagged by our sigma-clipping criterion and replaced by the second-pass polynomial baseline (Appendix B). This example corresponds to the line of sight hosting the brightest HI source in the simulation and illustrates the masking procedure.
Current usage metrics show cumulative count of Article Views (full-text article views including HTML views, PDF and ePub downloads, according to the available data) and Abstracts Views on Vision4Press platform.
Data correspond to usage on the plateform after 2015. The current usage metrics is available 48-96 hours after online publication and is updated daily on week days.
Initial download of the metrics may take a while.