Open Access
Fig. B.2.
Download original image
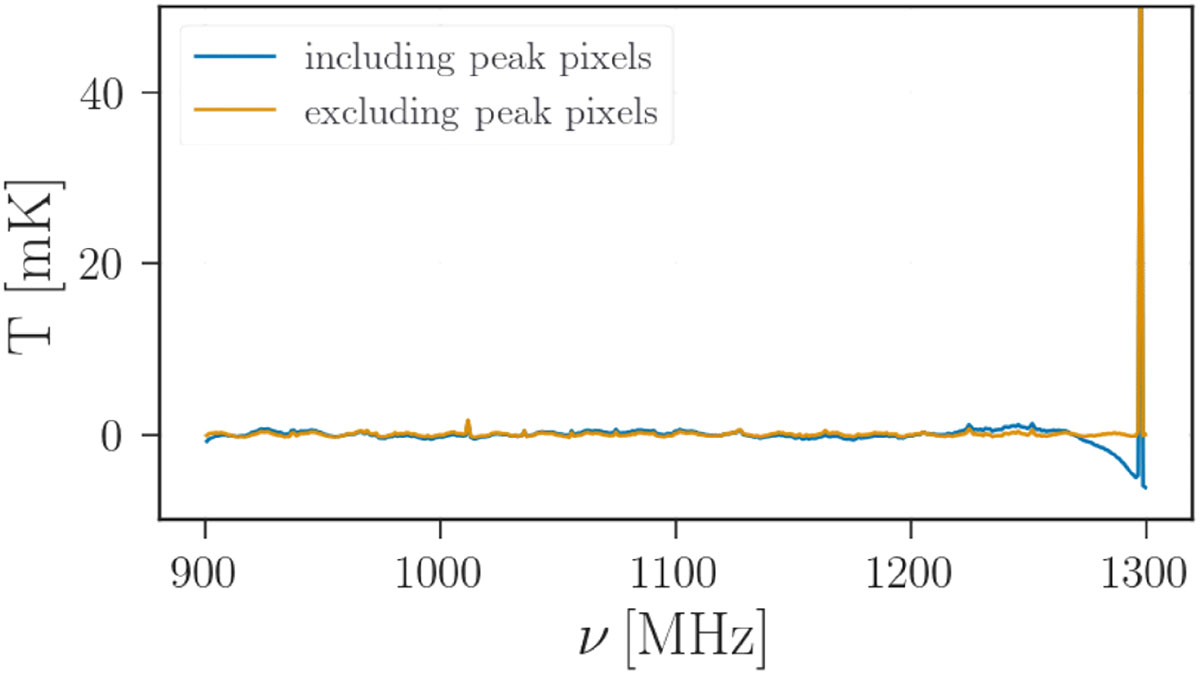
Flattened signal after baseline subtraction. The blue curve shows the result when all pixels are included in the polynomial fitting, while the orange curve shows the improved baseline obtained when bright outlier pixels are masked and excluded from the second fit.
Current usage metrics show cumulative count of Article Views (full-text article views including HTML views, PDF and ePub downloads, according to the available data) and Abstracts Views on Vision4Press platform.
Data correspond to usage on the plateform after 2015. The current usage metrics is available 48-96 hours after online publication and is updated daily on week days.
Initial download of the metrics may take a while.