Open Access
Fig. 4.
Download original image
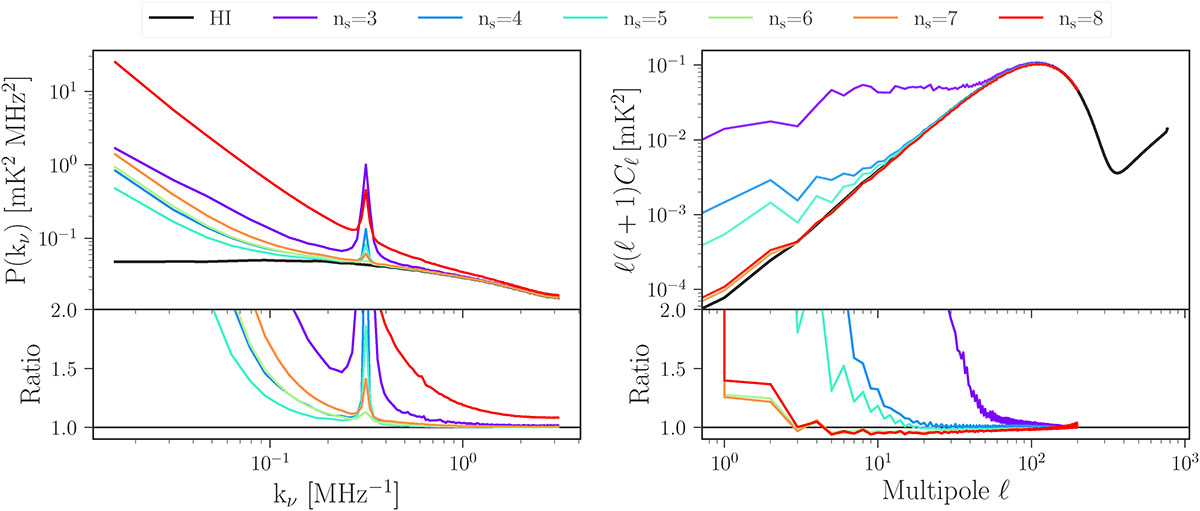
Reconstructed HI frequency (left) and angular (right) power spectra obtained with SDecGMCA for different choices of the number of sources (ns, shown in different colors). The black line shows the input HI signal for reference, and the lower panels display the ratio of the reconstruction and the true signal.
Current usage metrics show cumulative count of Article Views (full-text article views including HTML views, PDF and ePub downloads, according to the available data) and Abstracts Views on Vision4Press platform.
Data correspond to usage on the plateform after 2015. The current usage metrics is available 48-96 hours after online publication and is updated daily on week days.
Initial download of the metrics may take a while.