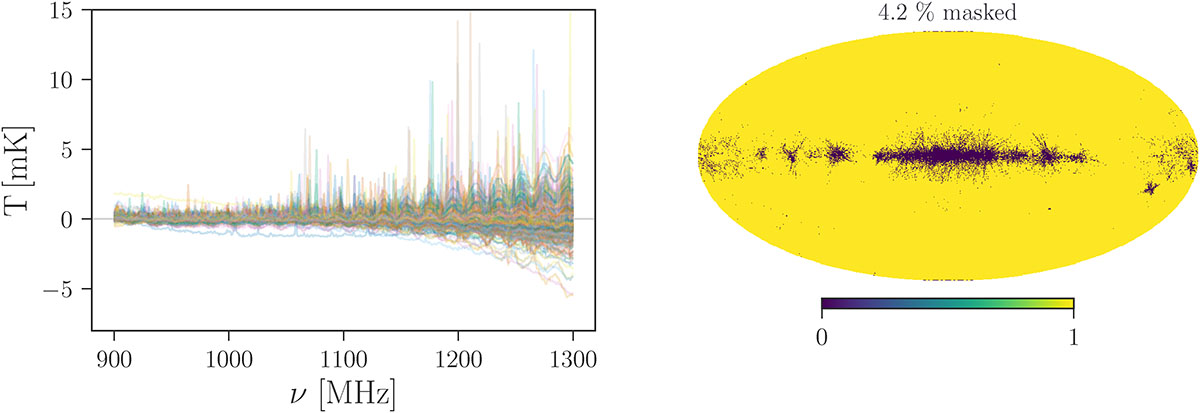
Fig. 5.
Download original image
Filtering lines of sight prior to computing the power spectrum of the reconstructed HI signal. Left: Brightness temperature of the reconstructed HI signal as a function of frequency for all flagged lines of sight that deviate from the expected spectral flatness. Right: Sky map showing the location of the flagged lines of sight, illustrating the regions excluded by the constructed mask. The percentage of lines of sight that are masked is indicated at the top of the map.
Current usage metrics show cumulative count of Article Views (full-text article views including HTML views, PDF and ePub downloads, according to the available data) and Abstracts Views on Vision4Press platform.
Data correspond to usage on the plateform after 2015. The current usage metrics is available 48-96 hours after online publication and is updated daily on week days.
Initial download of the metrics may take a while.