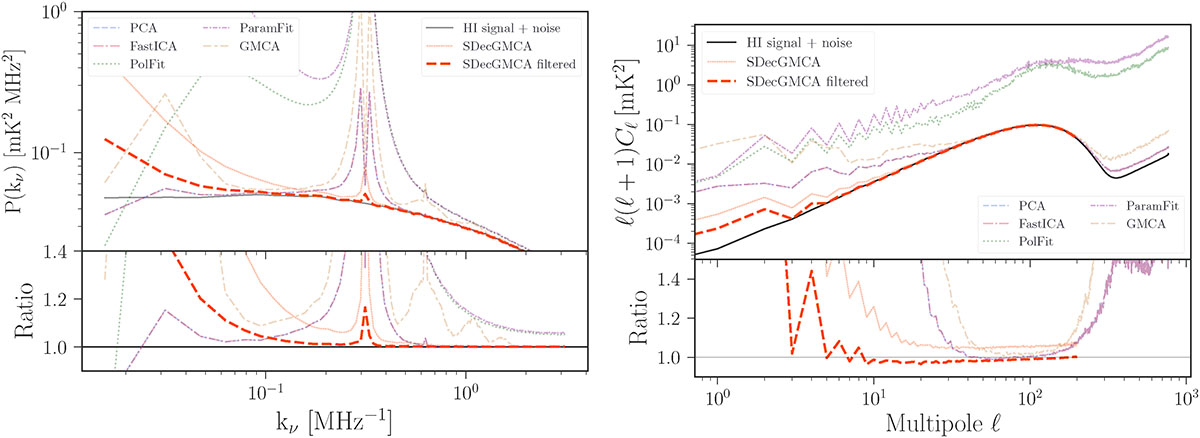
Fig. 6.
Download original image
Effect of post-processing masking on the HI signal reconstruction for the oscillating beam. Left: Frequency power spectrum of the reconstructed HI signal. The solid black curve shows the true HI signal plus noise, and the dotted red curve represents the SDecGMCA reconstruction before masking. The dashed red curve shows the result after excluding problematic lines of sight, which suppresses the spurious peak and improves recovery at lower kν. Other methods are shown in lighter transparent lines for comparison, with minimum improvement observed. Right: Same as the left panel, but for the angular power spectrum of the reconstructed HI signal. The top panel displays the reconstructed power spectra from different methods, and the bottom panel shows the ratio to the true signal.
Current usage metrics show cumulative count of Article Views (full-text article views including HTML views, PDF and ePub downloads, according to the available data) and Abstracts Views on Vision4Press platform.
Data correspond to usage on the plateform after 2015. The current usage metrics is available 48-96 hours after online publication and is updated daily on week days.
Initial download of the metrics may take a while.