Fig. 7.
Download original image
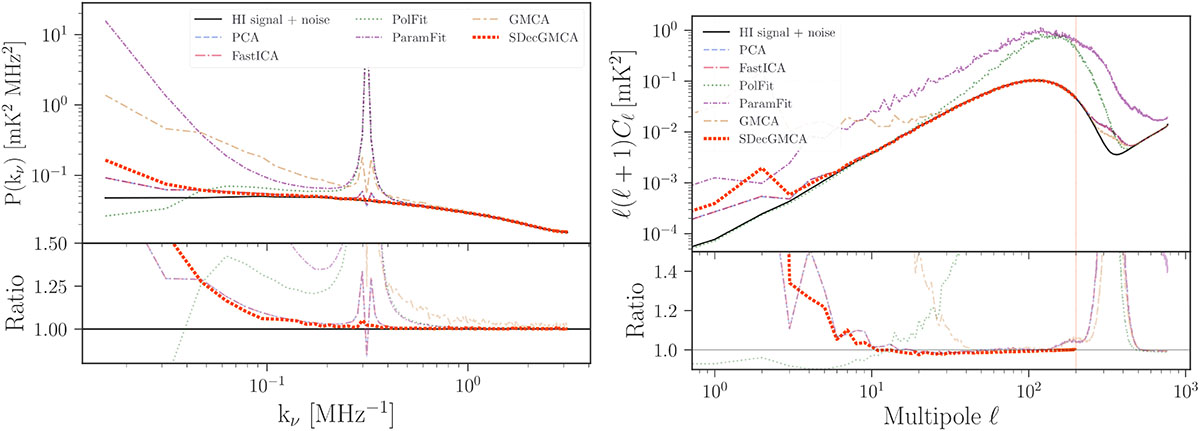
Frequency (left) and angular (right) power spectra of the reconstructed HI signal obtained with different foreground removal methods, shown in various colors. All methods were applied to simulated maps with artificially dimmed foregrounds. These maps were convolved with a Gaussian-oscillating beam prior to signal reconstruction.
Current usage metrics show cumulative count of Article Views (full-text article views including HTML views, PDF and ePub downloads, according to the available data) and Abstracts Views on Vision4Press platform.
Data correspond to usage on the plateform after 2015. The current usage metrics is available 48-96 hours after online publication and is updated daily on week days.
Initial download of the metrics may take a while.